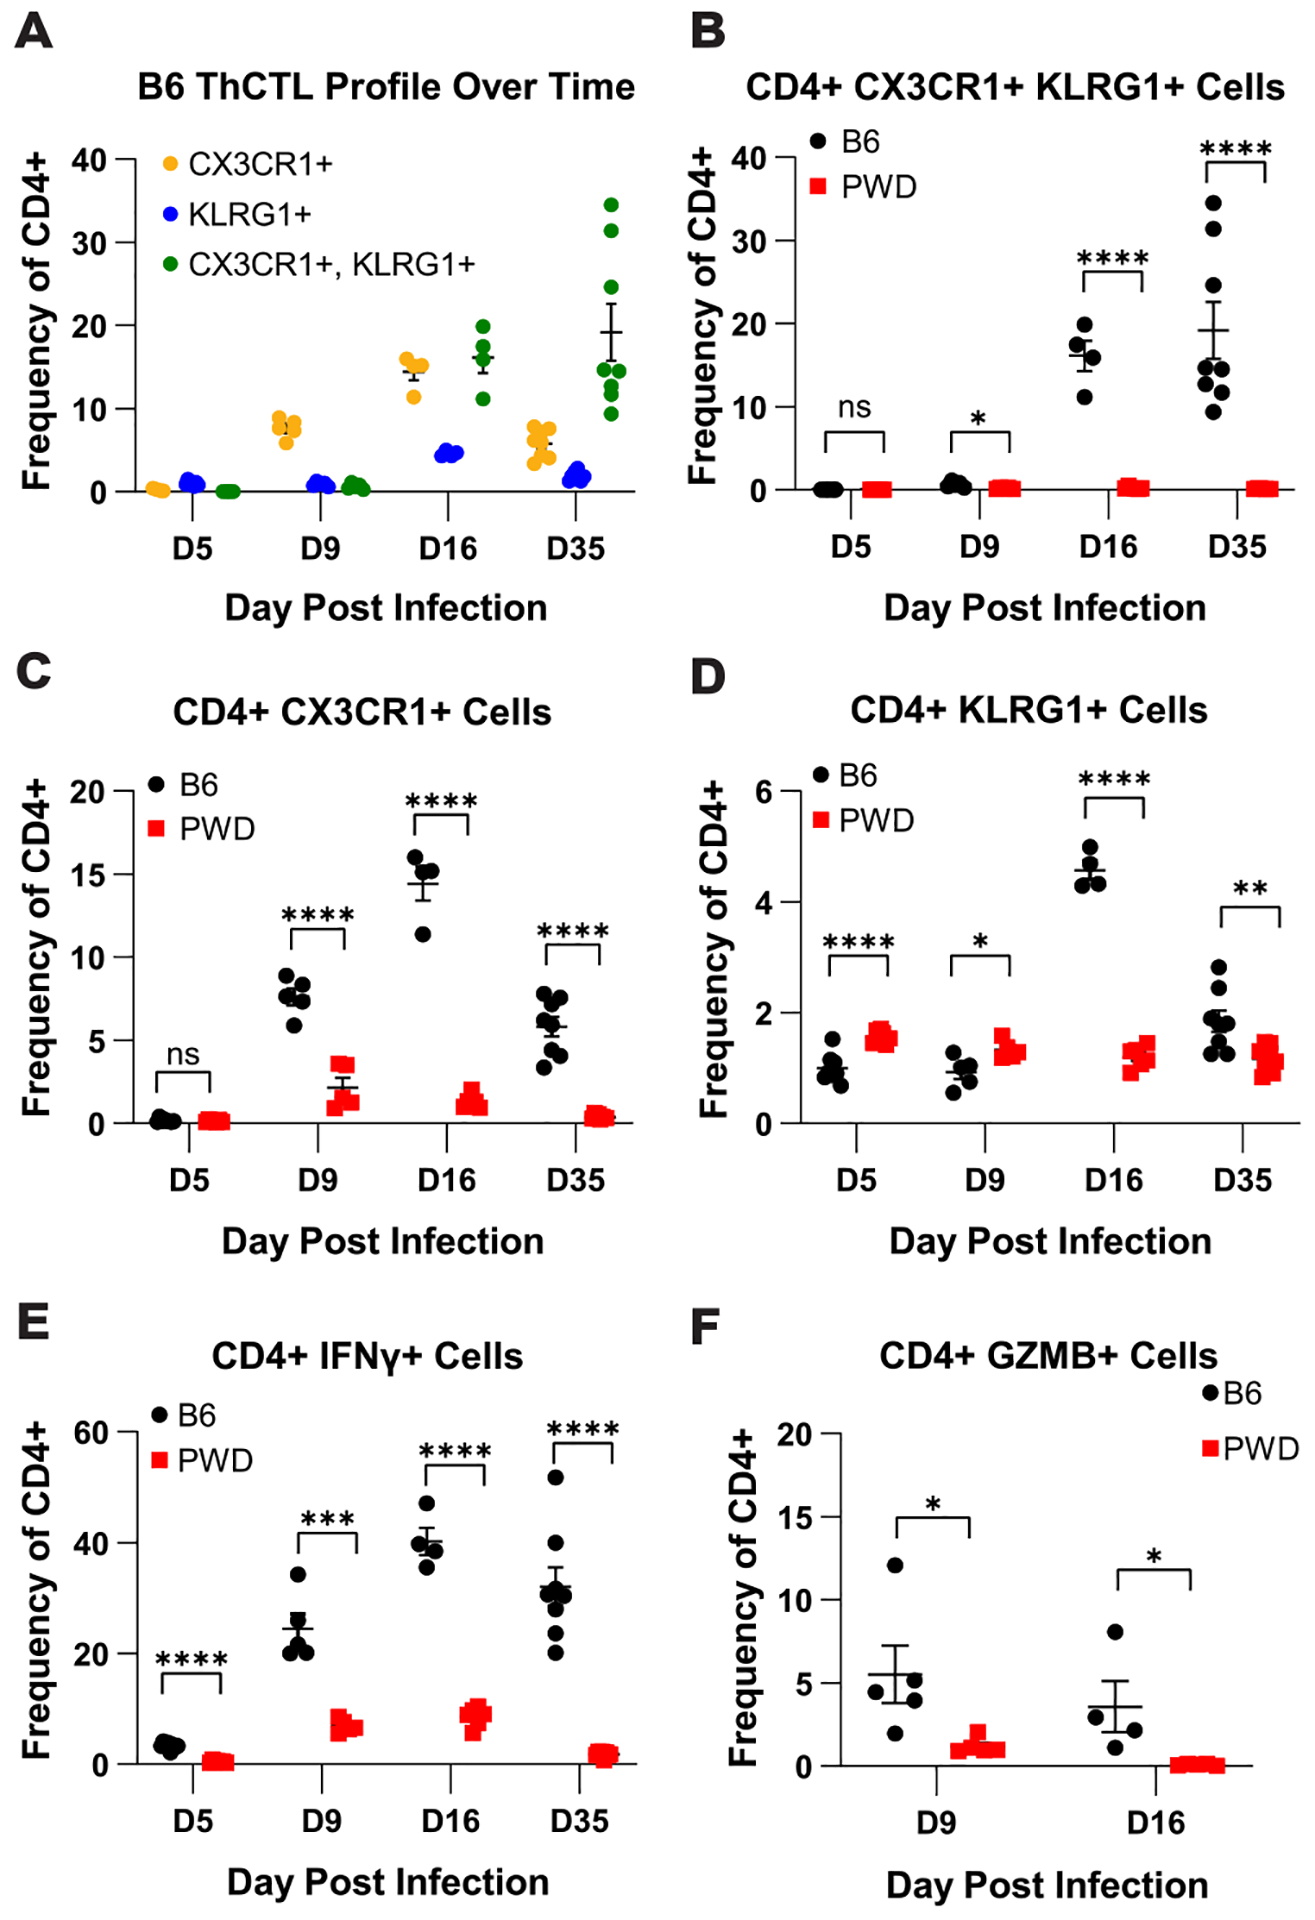
Figure 4. ThCTL cell expansion develops over the course of infection in B6 mice but remains muted across time in PWD mice.

B6 and PWD mice were i.p. infected MHV-68 as described in Figure 1. At 5 (D5) (4F + 4M B6 and 4F + 3M PWD), 9 (D9) (3F + 2M B6 and 3F + 2M PWD), 16 (D16) (2F + 2M B6 and 4F + 2M PWD), or 35 (D35) (4F + 4M B6 and 4F + 4M PWD) days post infection splenic leukocytes were isolated and flow cytometry was preformed to determine ThCTL kinetics during MHV-68 Infection (see Materials and Methods). Male and female data were pooled by genotype. (A) Kinetics of the CX3CR1+KLRG1+ cell subset frequency in CD4 T cells (TCRβ+CD4+CD11b−CD19−) during MHV-68 infection in B6 mice. Comparison of (B) Cx3CR1+KLRG1+, (C) CX3CR1+, (D) KLRG1+, (E) IFNγ+, and (F) GZMB+ cell populations as frequency of total CD4 T cells (TCRβ+CD4+CD11b−CD19−) in B6 and PWD mice over the course of MHV-68 infection. Significance of differences between B6 and PWD mice at each time point was determined via multiple unpaired T-tests and are indicated by the brackets where significant (p<0.05).
