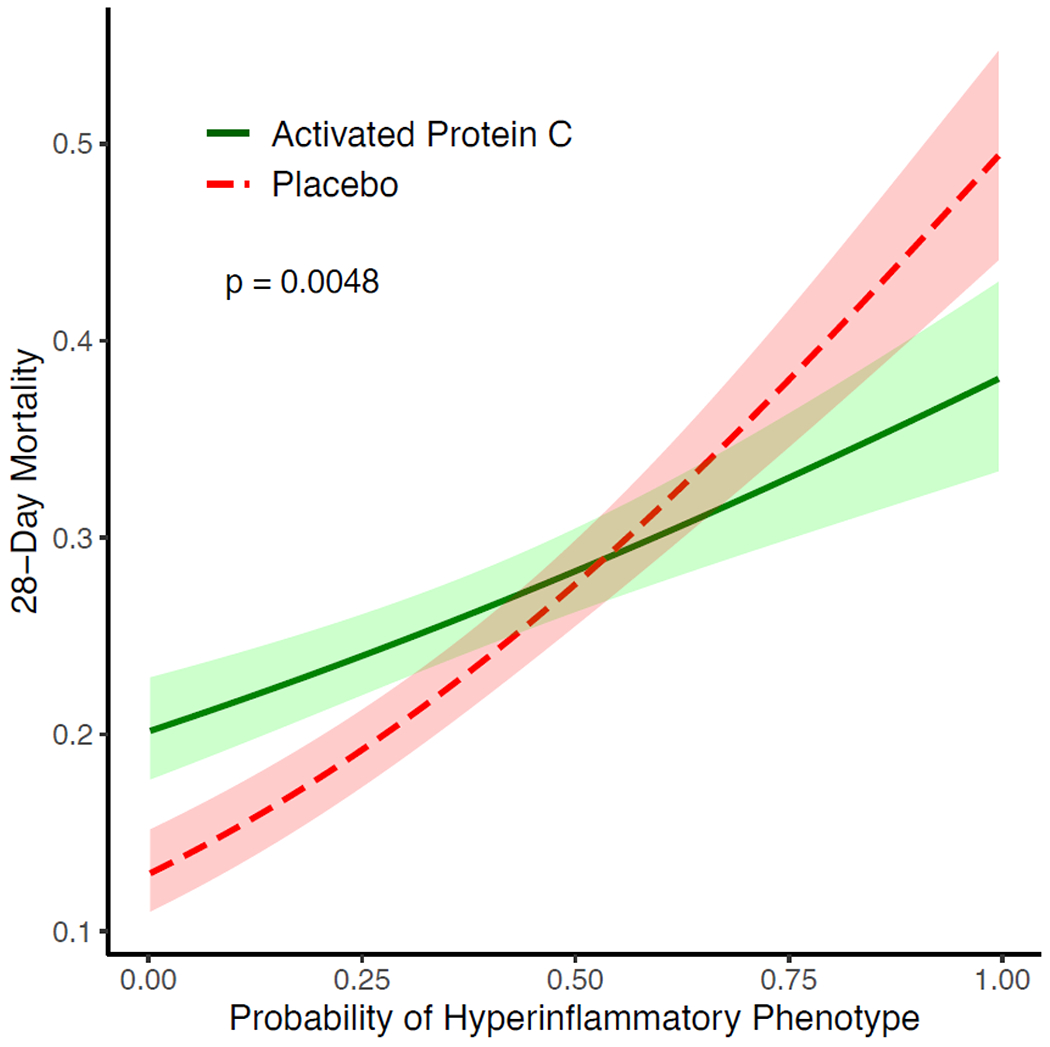
Figure 3: Differential treatment response to activated protein C (APC) according to probability of belonging to the Hyperinflammatory phenotype.

A logistic regression model was fit to predict mortality at Day 28 in the PROWESS-SHOCK trial, with the probability of belonging to the Hyperinflammatory phenotype (x-axis), treatment allocation, and their interaction term as predictor variables. The lines plot the estimated mortality in either placebo (red) or activated protein C (green) with 95% confidence intervals over a range of probabilities. P-value was generated using Wald test for the interaction term of probability and treatment allocation in the logistic regression model.
