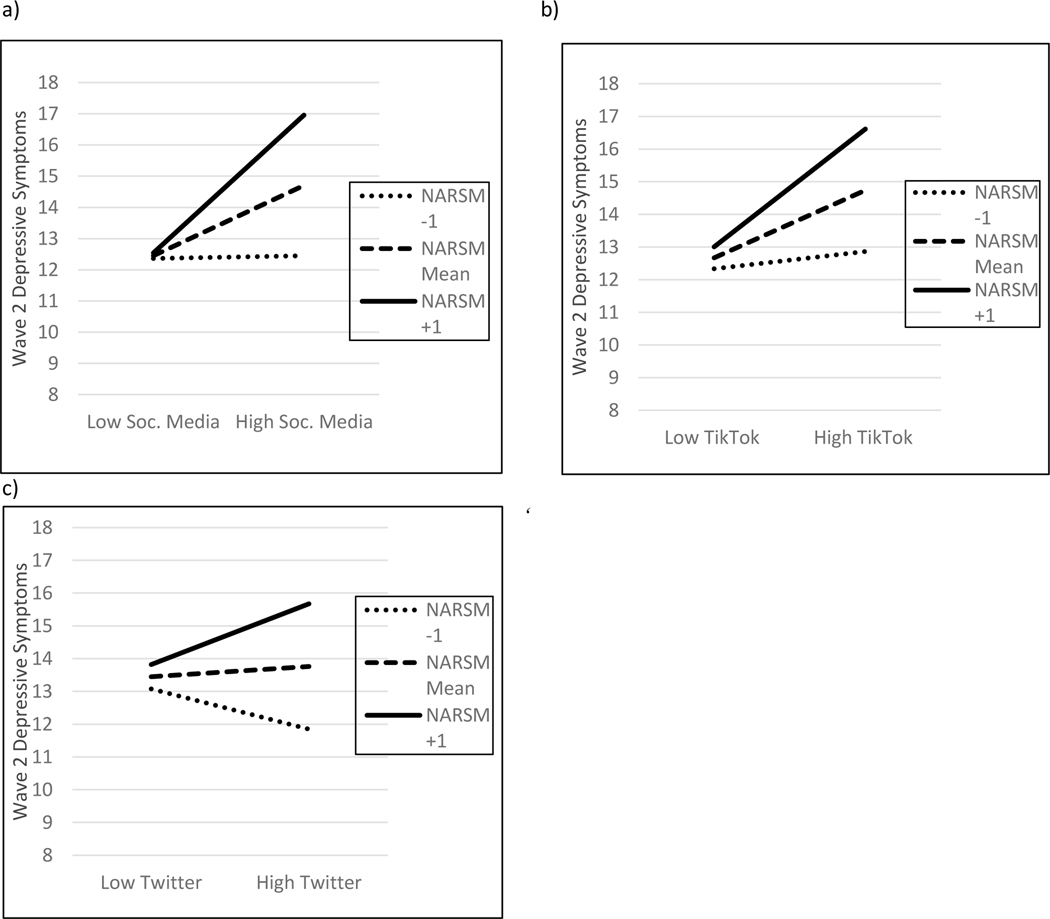
Figure 3. Interactions between Wave 2 Social Media Use and Wave 1 Negative Affective Reactions to Social Media (NARSM) for Wave 2 Depressive Symptoms using a) Total Social Media Frequency; b) TikTok Frequency; and c) Twitter Frequency.
Note. Lines are plotted for low (−1 SD), mean-level, and high (+1 SD) values of the NARSM and social media use (low = −1 SD; high = +1 SD). Covariates were for gender, Wave 1 depressive symptoms, and Wave 2 timing.

