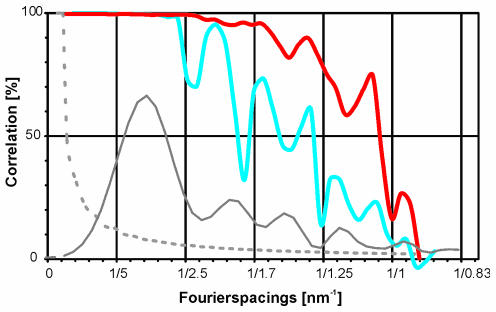
Fig. 5. Assessment of the effective resolution of the map. The Fourier shell correlation coefficient is plotted against Fourier spacing for the map corrected for the contrast transfer function including the envelope function Ks (red trace) and ignoring the envelope function Ks (blue trace). The average values of the squares of the contrast transfer functions (including Ks) for all 10 micrographs are shown as grey, solid trace. The significance level 3σ for the Fourier shell correlation coefficient is plotted as a dotted grey line.

An official website of the United States government
Here's how you know
Official websites use .gov
A
.gov website belongs to an official
government organization in the United States.
Secure .gov websites use HTTPS
A lock (
) or https:// means you've safely
connected to the .gov website. Share sensitive
information only on official, secure websites.
