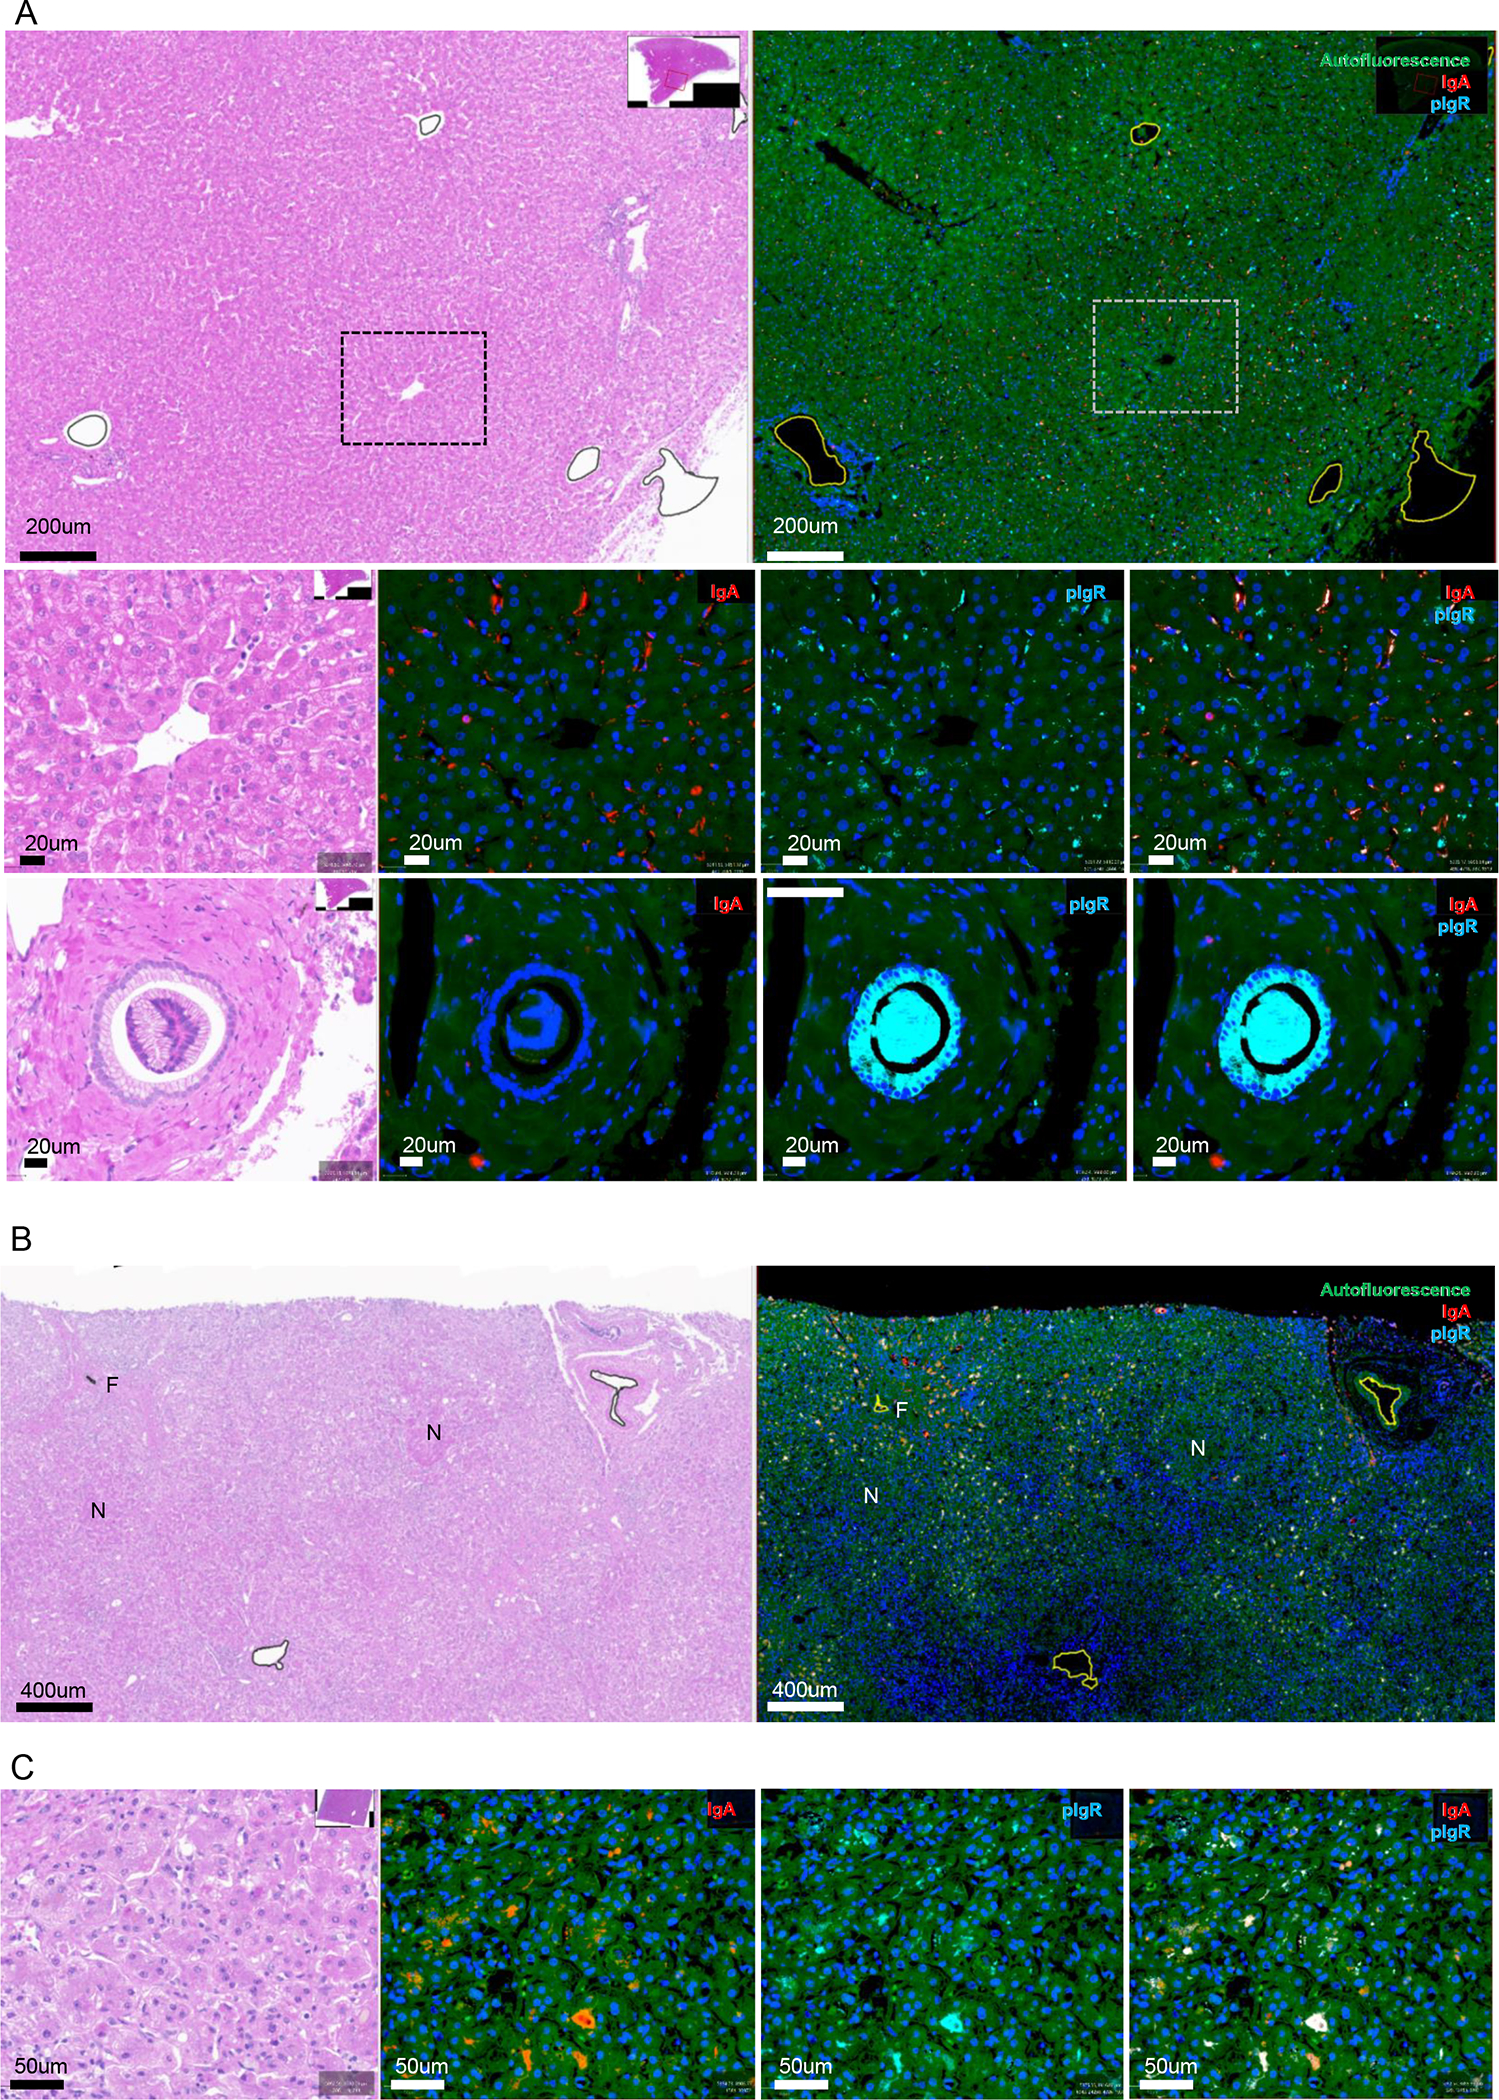
Figure 1. H&E staining and immunofluorescent detection of IgA and pIgR in alcohol-associated liver disease.

A) Representative images of H&E staining and staining for IgA (red) and pIgR (cyan) of non-alcoholic control liver slides. Low amounts of pIgR in canaliculi and apical poles of hepatocytes, and minimal IgA in hepatocytes. Large amounts of pIgR in the the cytoplasm of cholangiocytes.
B) Representative images of low magnification view of H&E staining and staining for IgA (red) and pIgR (cyan) in patients with alcohol-associated hepatitis. Increased IgA and pIgR staining localizing to zones of active fibroplasia, and away from hepatocytic nodules and end-stage fibrosis.
C) High magnification view of increased IgA and pIgR staining in patients with alcohol-associated hepatitis, with both IgA and pIgR localizing to canaliculi and apical poles of hepatocytes.
N, hepatocytic nodule. F, end-stage fibrosis. Green fluorescence, autofluorescence. Blue fluorescence, nuclei. Red fluorescence, IgA. Cyan fluorescence, polymeric immunoglobulin receptor (pIgR).
