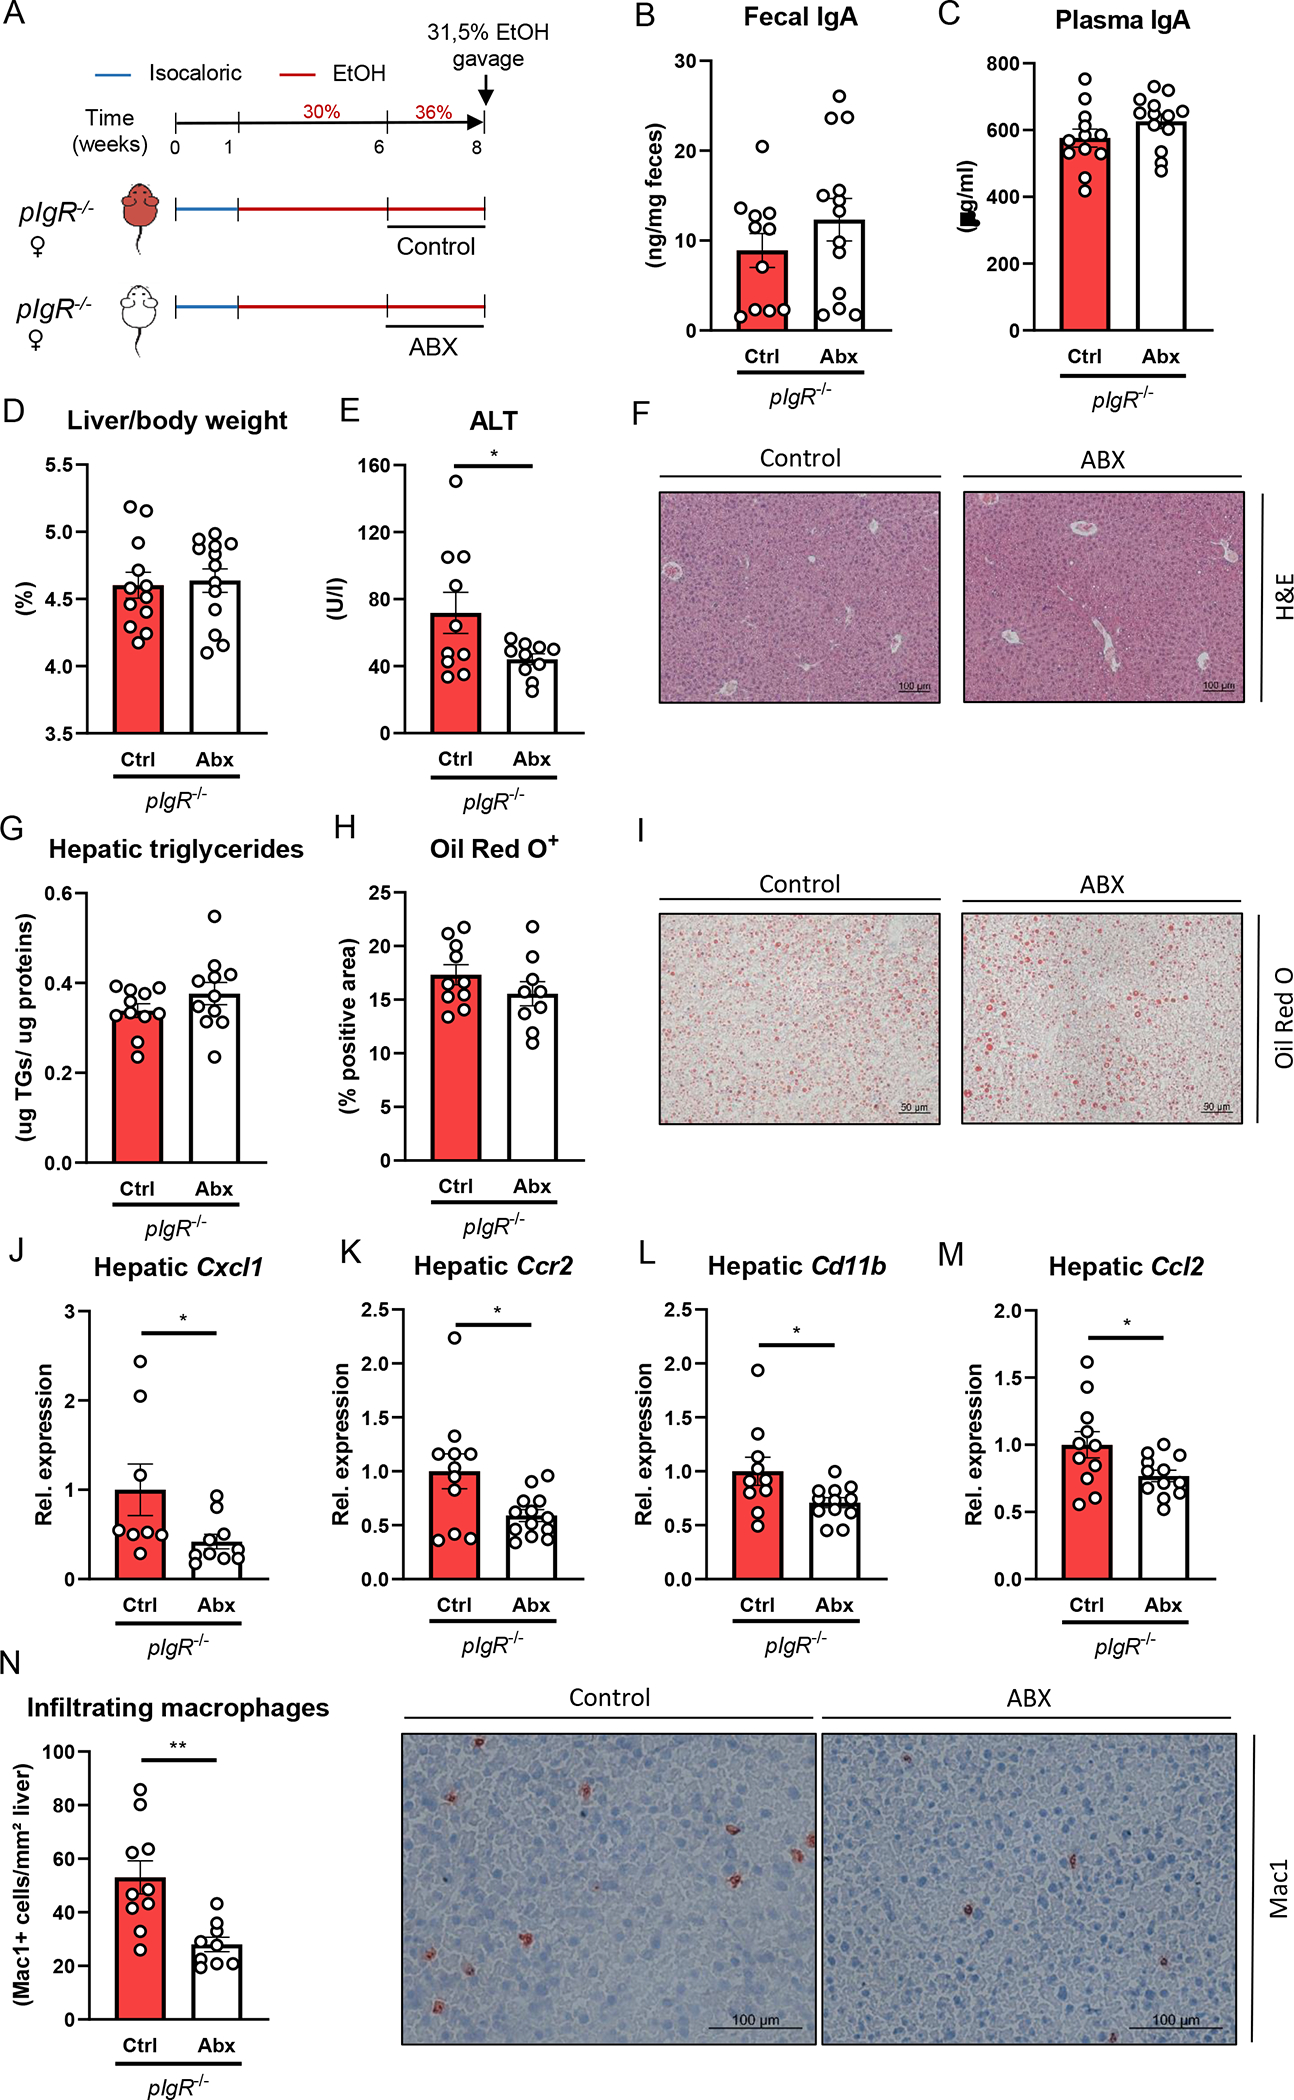
Figure 4. Treatment with non-absorbable antibiotics reduces ethanol-induced liver disease in pIgR−/− mice.

A) Schematic of intervention with antibiotics (white) or vehicle control (red) during the last two weeks of 8 weeks Lieber-DeCarli ethanol diet plus single gavage of ethanol in female pIgR−/− mice.
B) Fecal IgA levels at the end of the study.
C) Plasma IgA levels at the end of the study.
D) Liver to body weight ratio.
E) Plasma ALT levels.
F) Representative images showing H&E staining of liver sections.
G) Hepatic triglyceride content.
H) Quantification of immunohistochemical staining for lipids using Oil Red O.
I) Representative images showing Oil Red O staining of liver sections.
J-M) mRNA levels of indicated genes (Cxcl1, Ccr2, Cd11b, Ccl2) in livers of ethanol-fed mice as shown in Figure 4A, assessed by qPCR. Data are shown relative to the control-treated pIgR−/− mice and normalized to 18S.
N) Quantification and representative images of immunohistochemical staining for infiltrating macrophages and neutrophils in the liver using Mac-1.
Data shown as mean ± SEM of n=11–13 mice/group from 3 independent experiments. * indicates p≤0.05, ** p≤0.01. Exact p-values are provided in Table S4.
