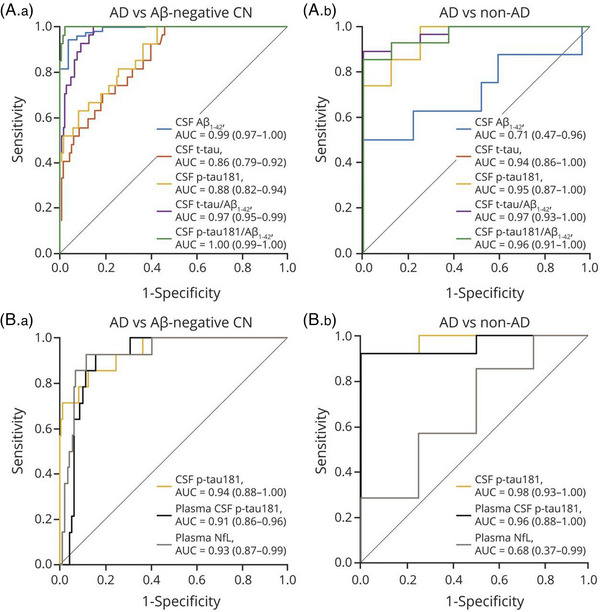
FIGURE 2.

ROC curves for distinguishing pathology‐confirmed AD dementia from non‐AD dementia and Aβ‐PET–negative healthy controls. ROC curves showing the performance of (A) Elecsys CSF biomarkers and (B) plasma biomarkers compared to CSF tau phosphorylated at threonine 181 (p‐tau181) for the discrimination of pathology‐confirmed AD dementia from (A.a and B.a) Aβ‐PET–negative healthy controls and (A.b and B.b) non‐AD dementia. AUC and 95% confidence interval are reported in the inset of each panel. Aβ, amyloid beta; AD, Alzheimer disease; AUC, areas under the curve; CN, cognitively normal; CSF, cerebrospinal fluid; NfL, neurofilament light; PET, positron emission tomography; ROC, receiver operating characteristic; T‐tau, total tau. Reproduced under open access from Grothe et al. 58
