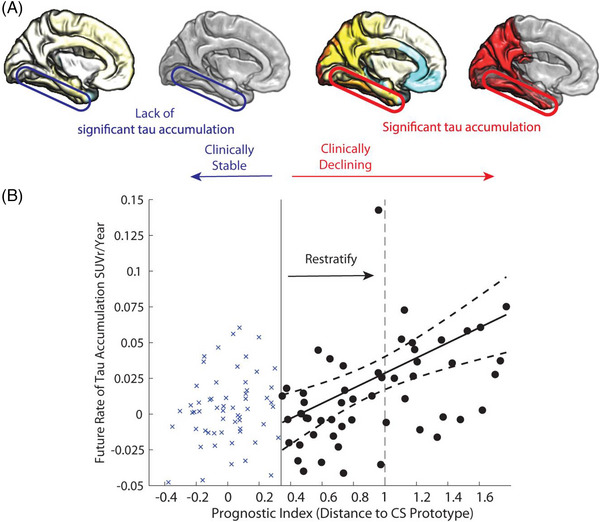
FIGURE 4.

Tau prognostic index to predict future tau accumulation. (A), Cortical maps show average rate of tau accumulation for individuals classified as Clinically Stable (CS) versus Clinically Declining (CD). (B), Relationship of the scalar projection with future rate of tau accumulation within the fusiform gyrus (circled in cortical maps are shown in [A]). The solid black vertical line indicates the probabilistic boundary used to perform the binary stratification, blue crosses indicate rate of tau accumulation for the clinically stable group, black circles indicate future rate of tau accumulation for the clinically declining group. Restratification to a more stringent threshold, indicated by the dashed black vertical line, using the prognostic index allows a new sample to be selected with higher future rates of tau accumulation and lower heterogeneity within the sample. SUVR, standardized uptake value ratio. Reproduced under open access from Giorgio et al. 130
