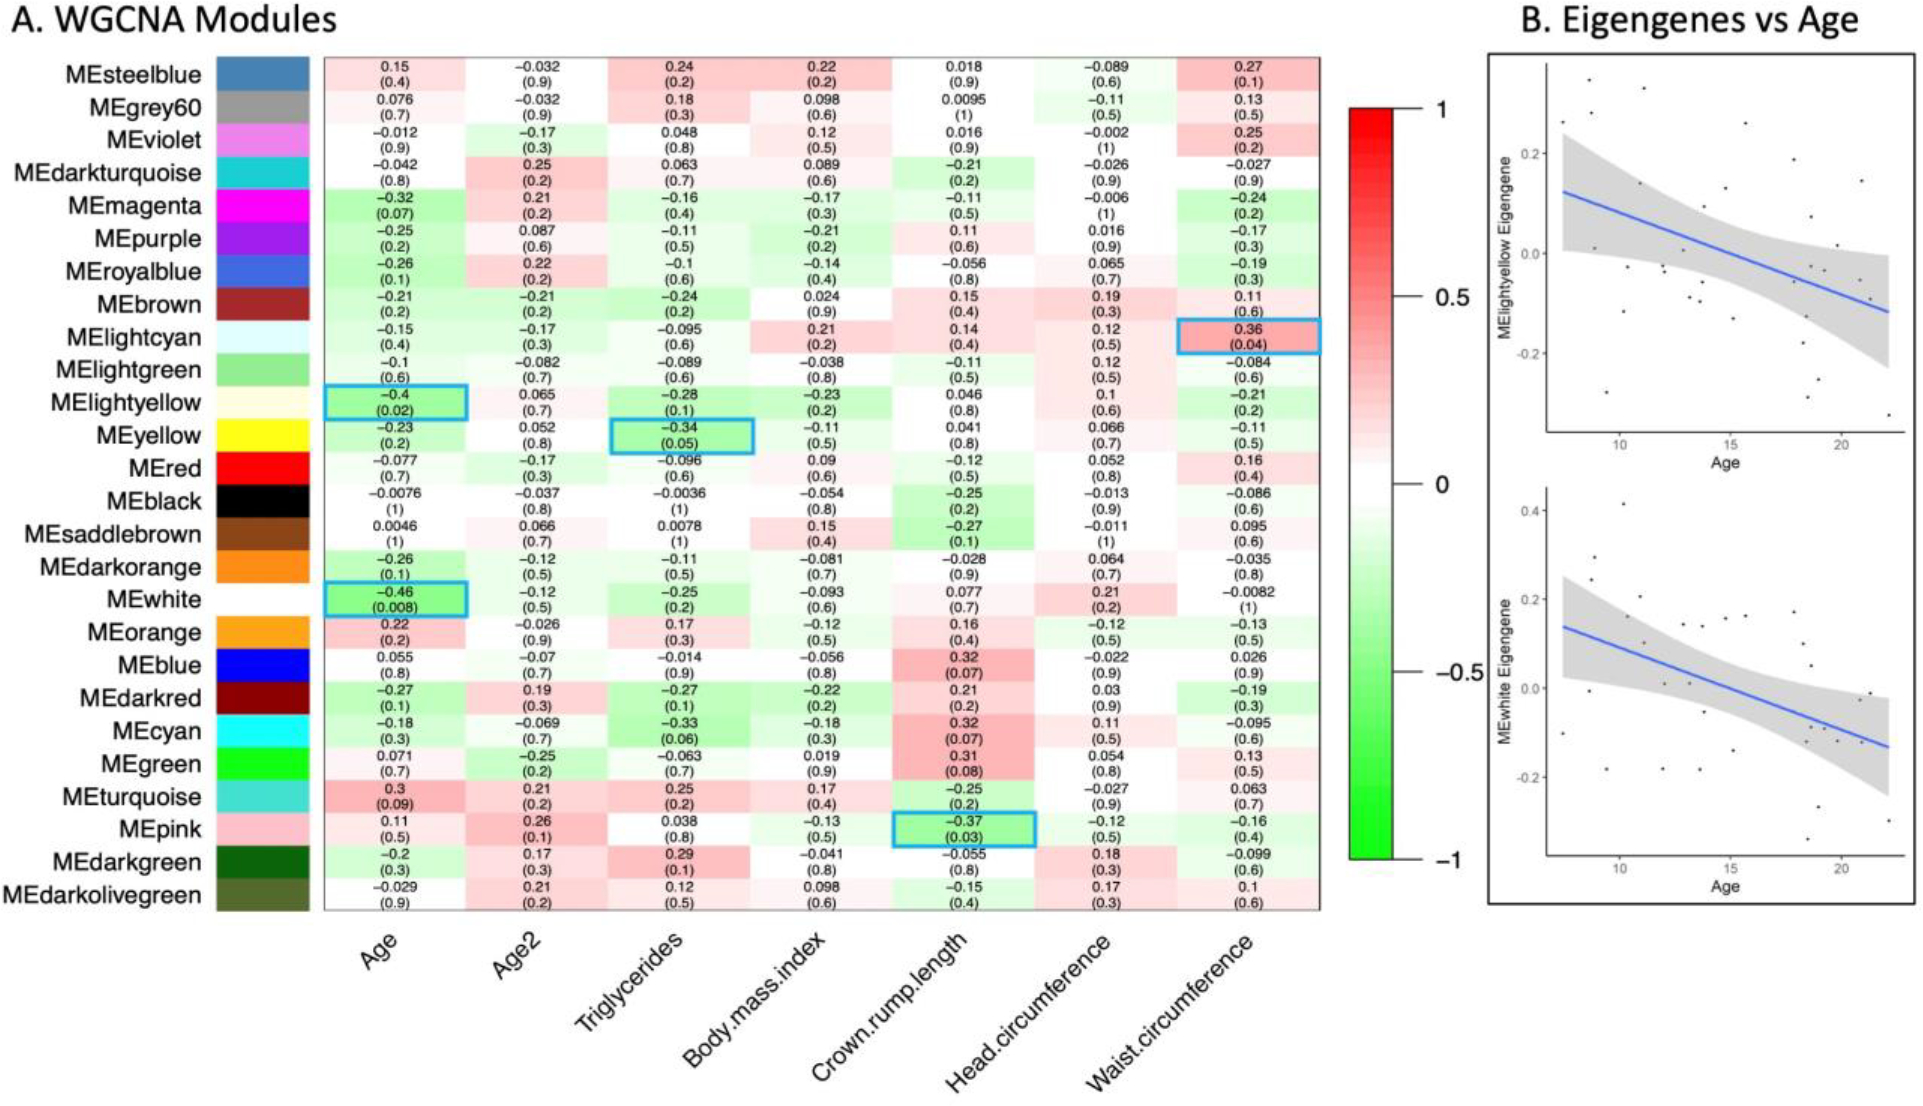
Figure 1: WGCNA of omic data.

A) Modules associated with age and age-correlated traits. Each row corresponds to a module, the bottom column labels indicate each quantitative trait correlated with omic modules. Numbers in each box indicate correlations with p-values in parentheses. Positive correlations are indicated with red fill, negative with green fill, and significant modules are outlined blue. B) Plots of eigengenes versus age for the age-associated modules MElightyellow and MEwhite.
