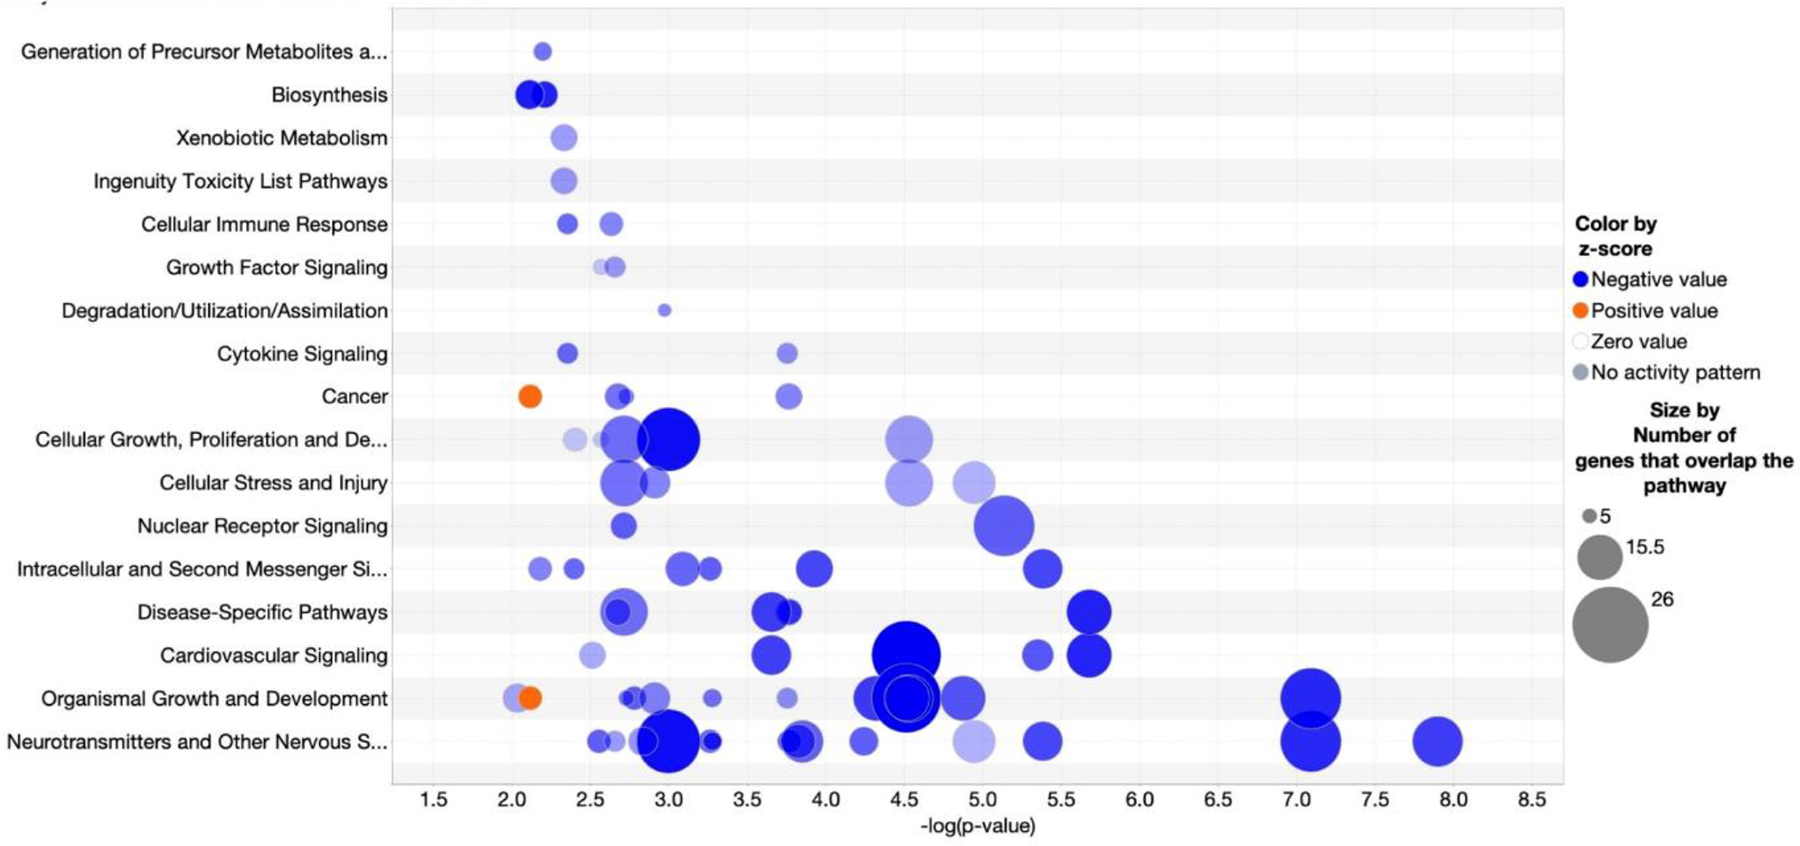
Figure 2: Pathway Classification.

Bubble chart of significantly enriched, overlapping pathways with ≥ 5 genes in common. Pathways with enrichment −log (p-value) > 3.2 and absolute z-score >1.0 are shown. The x-axis shows the −log (p-value) and y-axis shows the pathways. Blue fill indicates pathways decreasing with age, orange indicates pathways increasing with age, and size of the circle denotes the number of omic molecules in the pathway.
