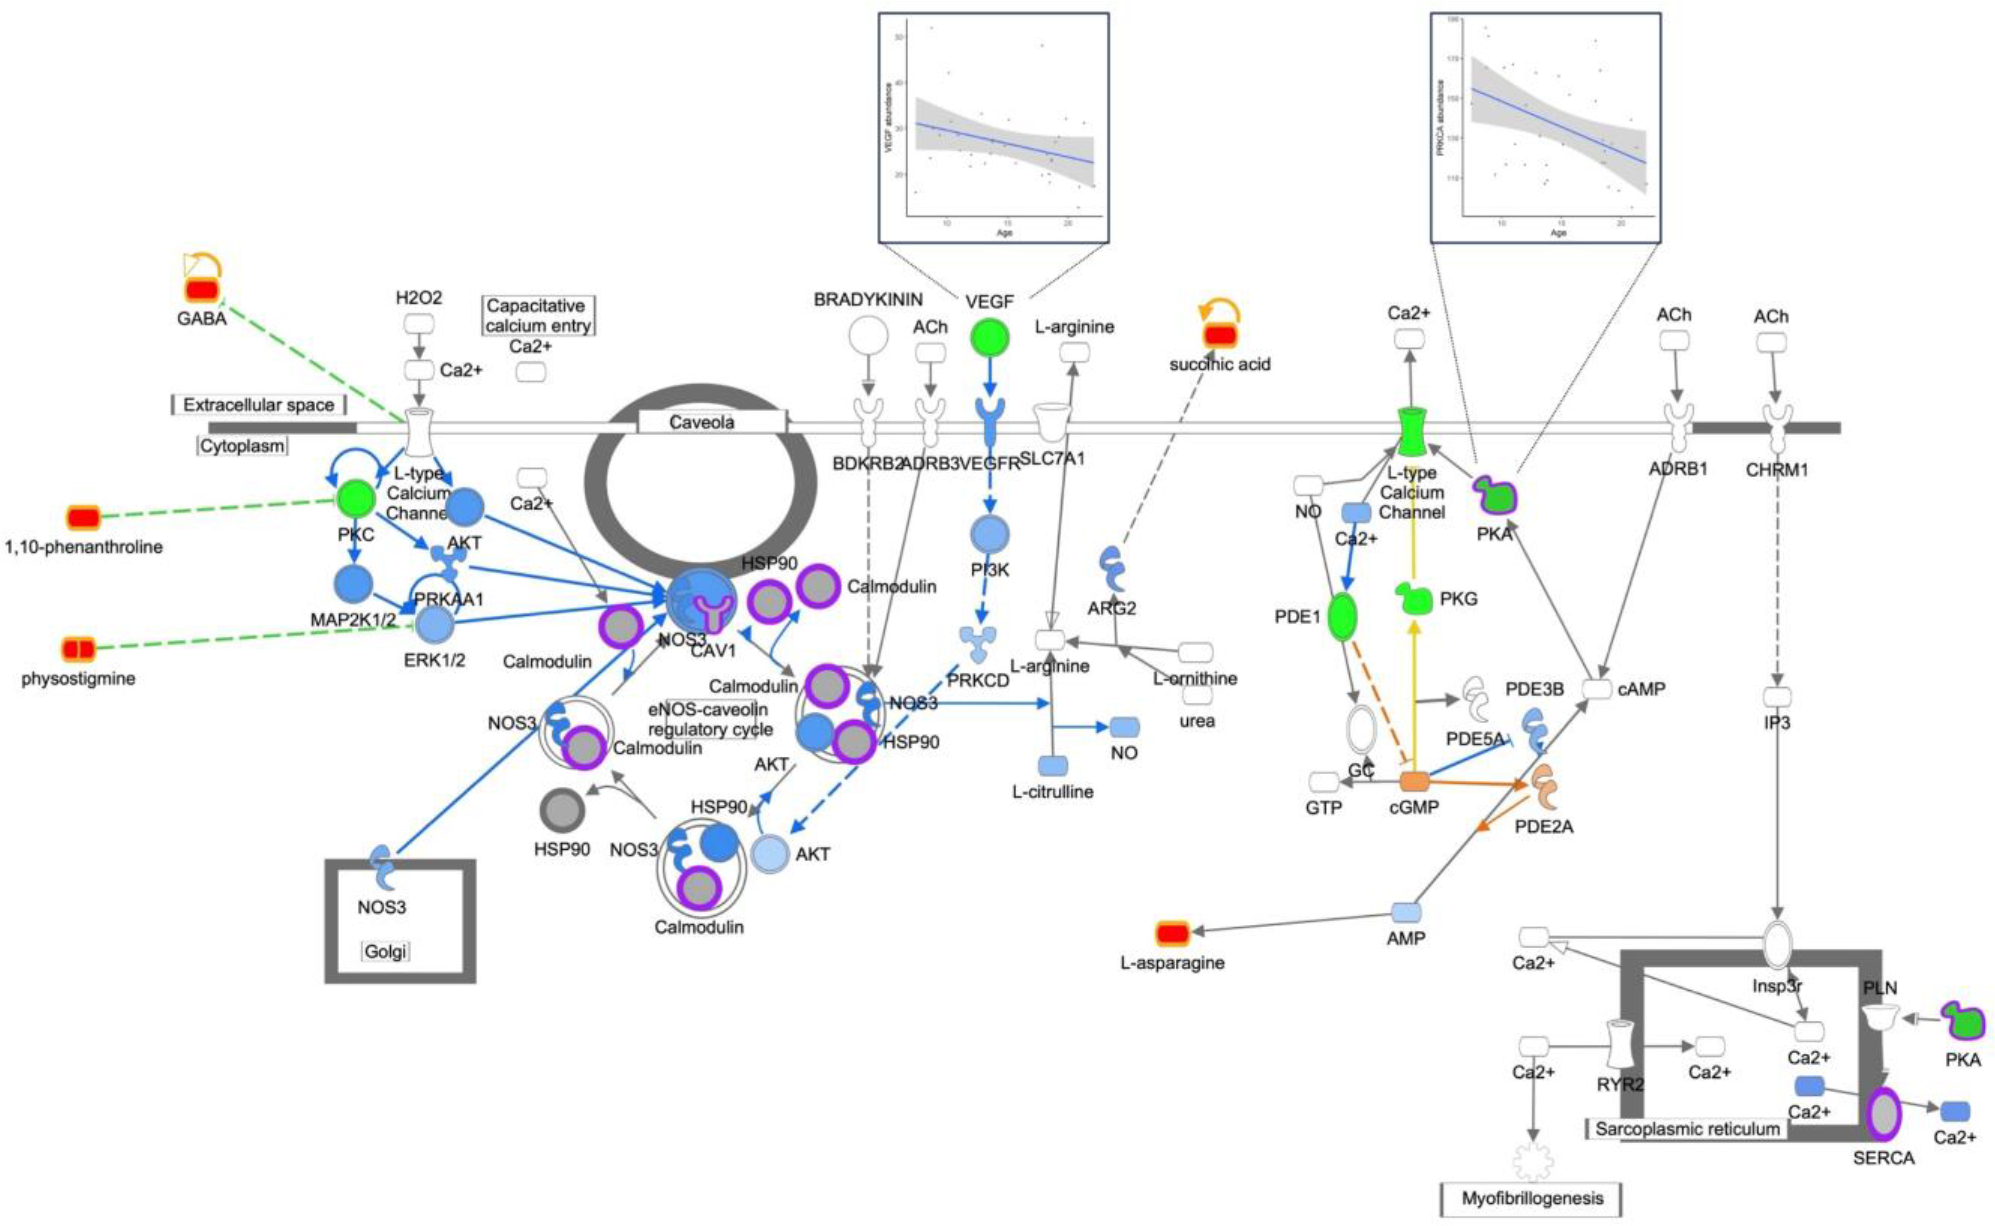
Figure 4: Nitric Oxide Signaling; p-val 4.0−06.

Nitric Oxide Signaling. Genes are indicated by green outline, proteins by purple outline, metabolites by gold outline, red fill indicates increased abundance with age, green fill decreased abundance with age, and gray fill indicates no change in abundance. Pathway enrichment p-value = 4.0−06. Inserts of example correlation plots for molecule abundance and age are shown for VEGF and PKA.
