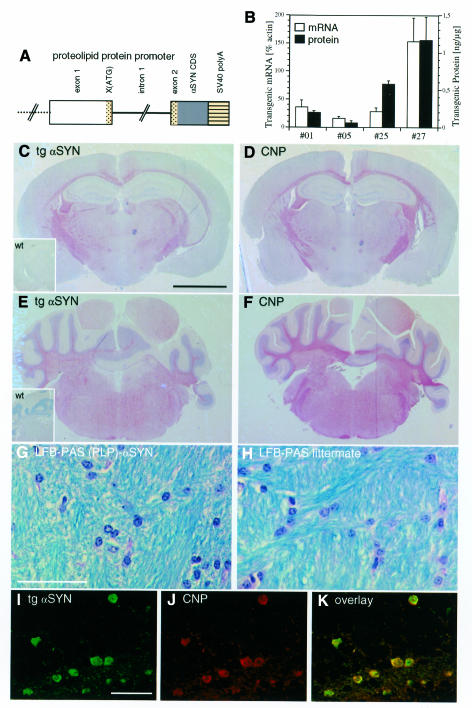
Fig. 1. OL-specific expression of PLP-driven αSYN in transgenic mice. (A) Schematic representation of (PLP)-αSYN construct (not drawn to scale). The 5′ region of the PLP gene is shown as an open box, and exon 1 and the initial segment of exon 2 is shown as a dotted region with the mutated ATG→GAG and the first 13 codons of PLP in exon 2. Intron 1 is shown as a solid line, human wild-type αSYN coding sequence as a dark box and the SV40 polyadenylation signals as a striped box. (B) Transgenic αSYN mRNA expression levels relative to β-actin (open bars) were determined in duplicate (error bars: range) by quantitative northern blotting. The amount of transgenic αSYN protein (closed bars) was determined in three individual mice of each line (error bars: standard deviation) by quantitative western blotting of whole-brain cytosol samples. (C–F) Coronal sections from a representative (PLP)-αSYN mouse (line 27) at the level of the hippocampus (C and D) and cerebellum (E and F) stained with 15G7 anti-αSYN (C and E) and anti-CNP (D and F). Inserts in C and E show no staining with the 15G7 antibody in wild-type mice. Scale bar in (C) corresponds to 2.5 mm. (G and H) Cerebellar white matter of a transgenic mouse (G) and a non-transgenic littermate (H) stained with LFB-PAS shows no demyelinization. Scale bar in (G) corresponds to 50 µm. (I–K) Confocal laser scanning images of a section from (PLP)-αSYN mouse cerebellum double-labeled with 15G7 anti-αSYN (green, I) and anti-CNP (red, J); overlay (K). Scale bar in (I) corresponds to 50 µm.

An official website of the United States government
Here's how you know
Official websites use .gov
A
.gov website belongs to an official
government organization in the United States.
Secure .gov websites use HTTPS
A lock (
) or https:// means you've safely
connected to the .gov website. Share sensitive
information only on official, secure websites.
