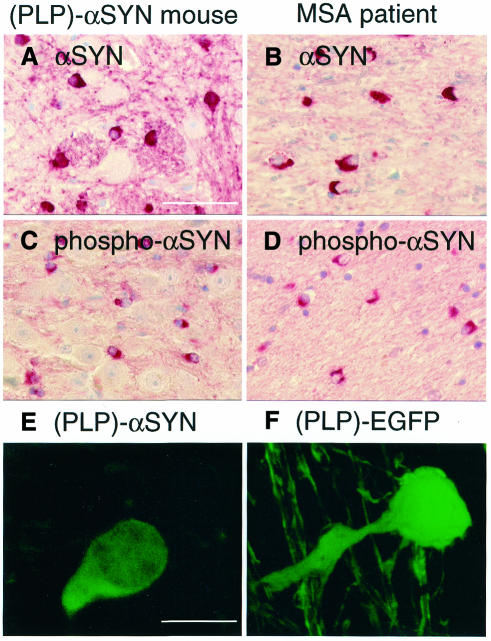
Fig. 2. Pathological subcellular localization and hyperphosphorylation of αSYN expressed in transgenic mouse OLs. (A–D) Cerebellar white matter sections from (PLP)-αSYN mice (A and C) and MSA patients (B and D) were stained with human-specific 15G7 anti-αSYN (A and B) and phospho-specific anti-αSYN (C and D). Scale bar in (A) corresponds to 50 µm. (E and F) Individual OL from a (PLP)-αSYN mouse stained with 15G7 anti-αSYN (E) and green fluorescence of a (PLP)-EGFP mouse OL (F). Scale bar in (E) corresponds to 10 µm.

An official website of the United States government
Here's how you know
Official websites use .gov
A
.gov website belongs to an official
government organization in the United States.
Secure .gov websites use HTTPS
A lock (
) or https:// means you've safely
connected to the .gov website. Share sensitive
information only on official, secure websites.
