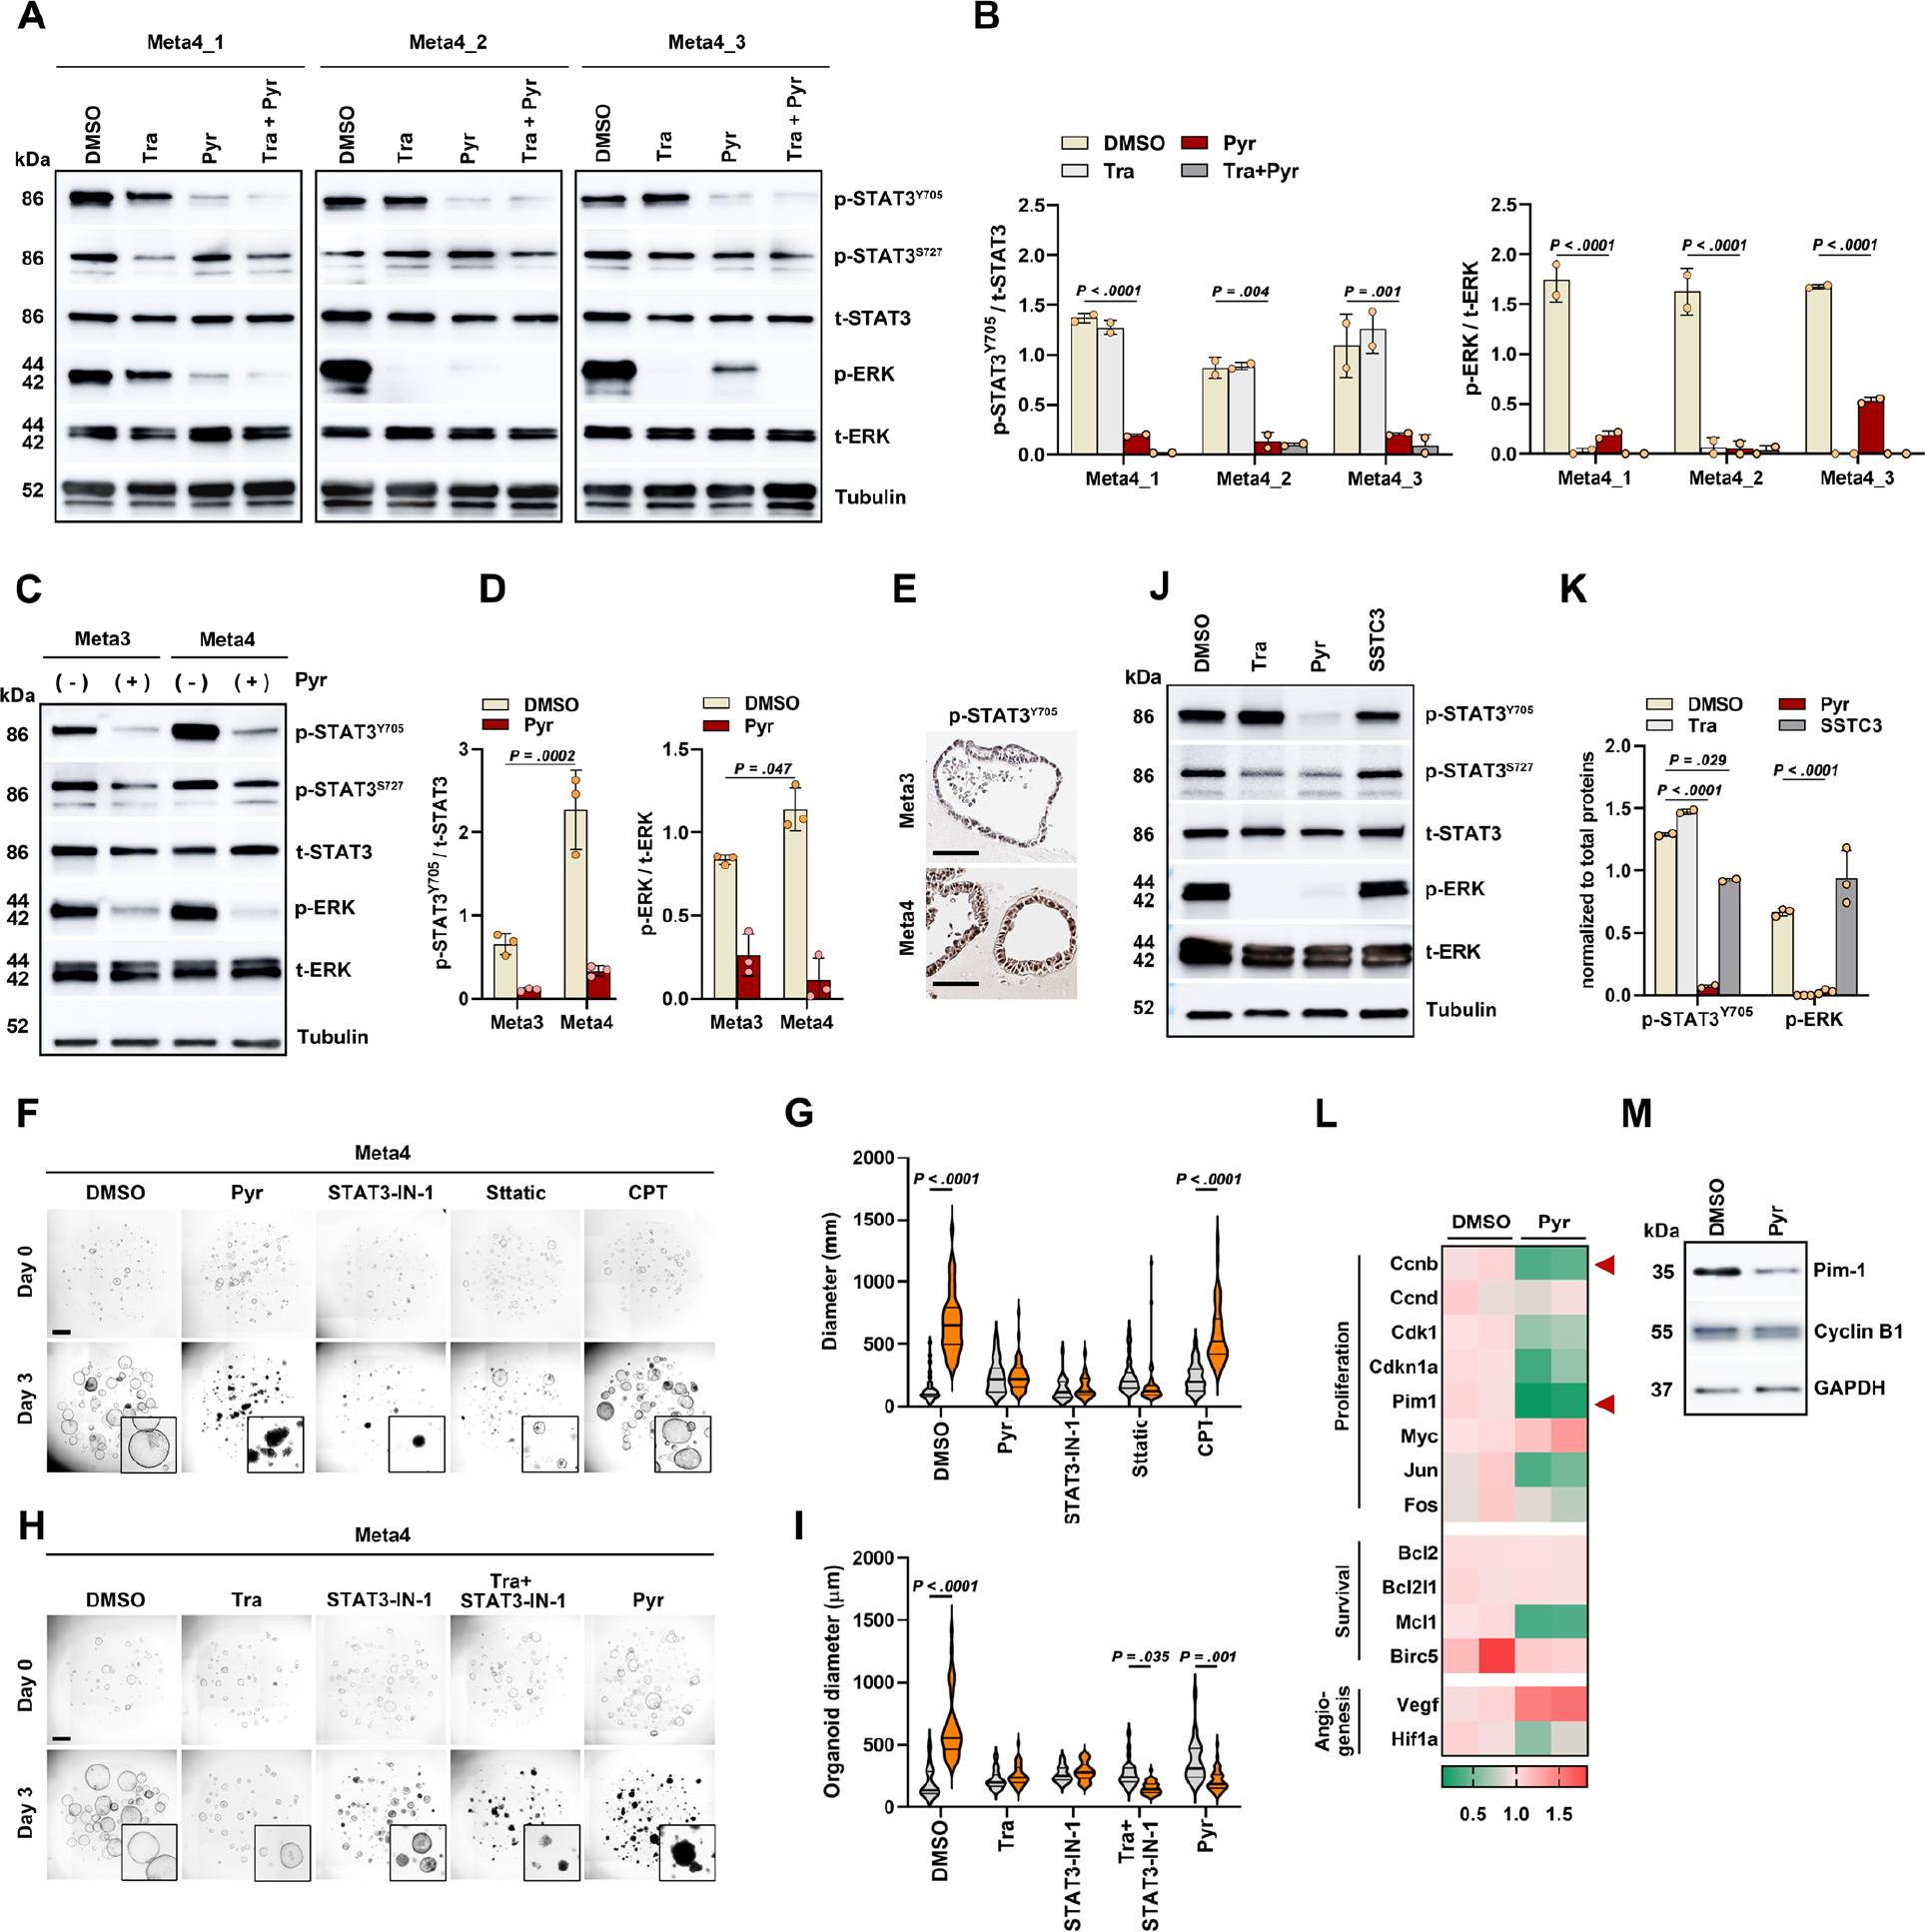
Figure 3. Pyrvinium suppresses mouse dysplastic organoids through a double blockade of ERK and STAT3 signaling pathways.

(A and B) Western blot analysis for phospho-STAT3 (p-STAT3) and phospho-ERK (p-ERK) in three Meta4 organoid lines after treatment of Trametinib (Tra), Pyrvinium (Pyr) and their combinations for 1 day (A) and ratios of p-STAT3/total STAT3 and p-ERK/total ERK (B). (C and D) Western blot for p-STAT3 and p-ERK in Meta3 and Meta4 organoids (C) and ratios of p-STAT3/total STAT3 and p-ERK/total ERK (D). (E) Immunostaining for p-STAT3 in Meta3 and Meta4 organoids. (F and G) Phase-contrast images of Meta4 organoids treated with DMSO, Pyr (100nM), STAT3-IN-1 (1μM), Stattic (2μM), and Cryptotanshinone (CPT) (5μM) for 3 days (F), and quantitation of organoid diameters before and after treatment (G). (H and I) Phase-contrast images of Meta4 organoids treated with DMSO, Trametinib (Tra, 1μM), STAT3-IN-1 (500nM), combination of Tra and STAT3-IN-1, and Pyr, for 3 days (H), and quantitation of organoid diameters before and after treatment (I). (J and K) Western blot for p-STAT3 and p-ERK after treatment of Tra, Pyr, and SSTC3 (J) and ratios of p-STAT3/t-STAT3 and p-ERK/t-ERK (K). (L) Heatmap of quantitative real time-PCR analysis for STAT3 target genes in Meta4 organoid treated with DMSO or Pyr for 1 day. Relative quantification of each gene expression level was normalized to β-actin gene expression. Color scale represents normalized mRNA expression values. n= 3 biological replicates. (M) Representative protein levels of Pim-1 and Cyclin-B1 after treatment. Mean ± standard deviation. One or two-way ANOVA with Tukey’s multiple comparisons. Scale bar = 500 μm
