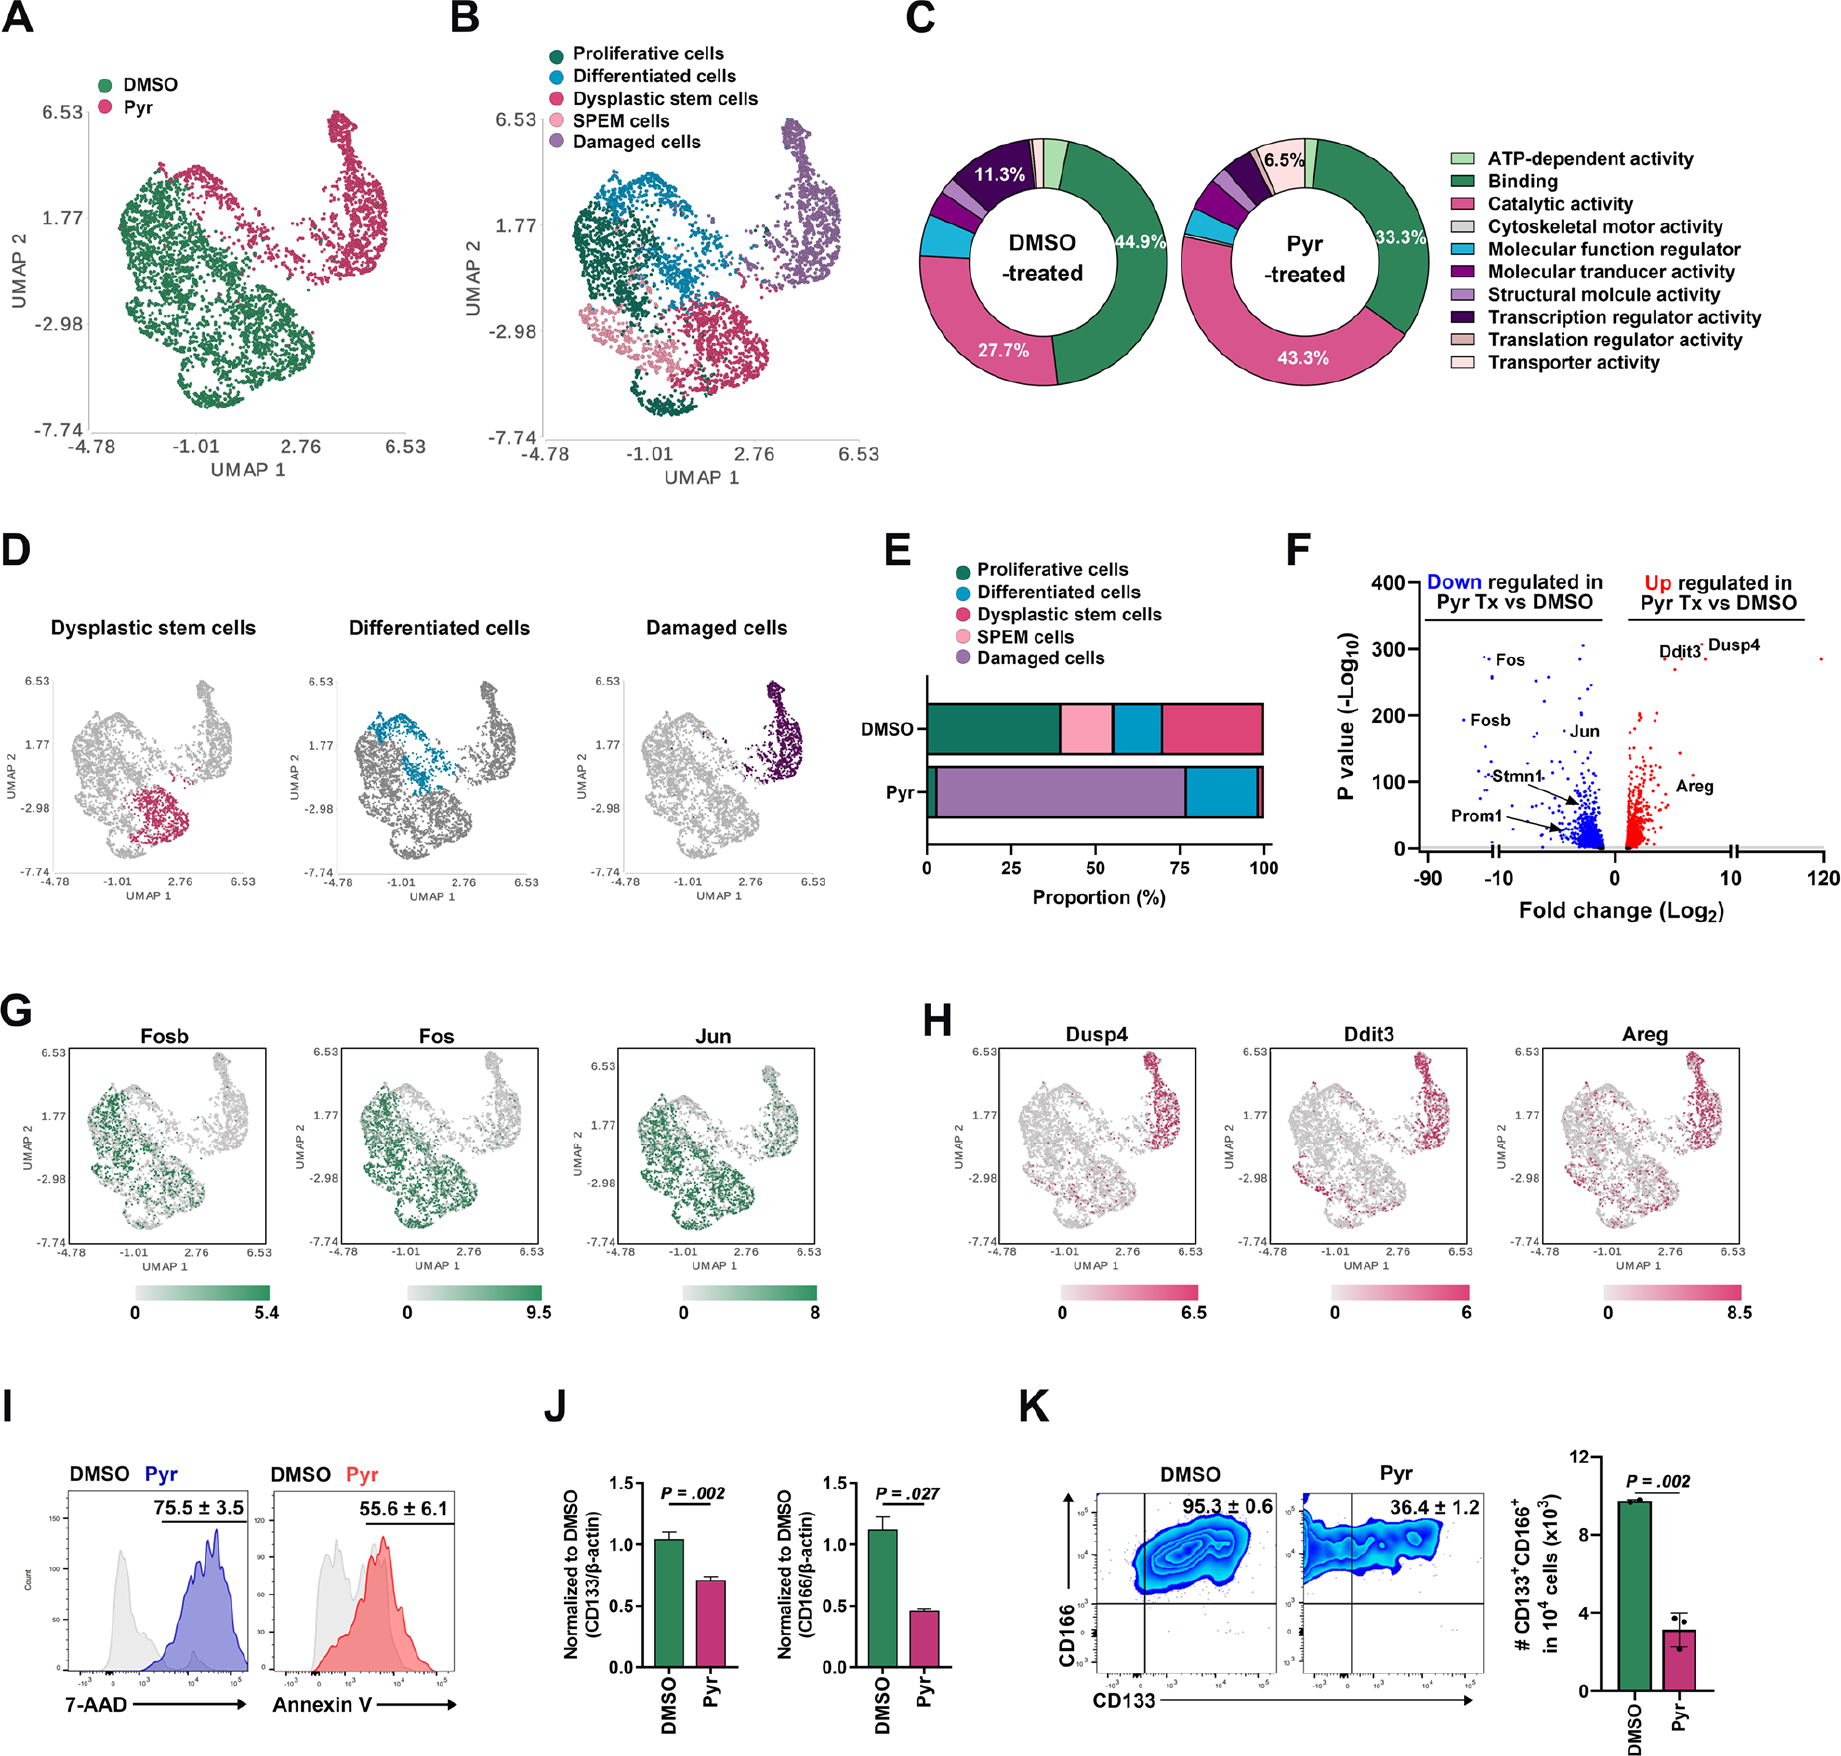
Figure 4. Pyrvinium targets stem cell population in mouse dysplastic organoids.

(A and B) A superimposed Uniform Manifold Approximation and Projection (UMAP) plot showing annotated clusters from DMSO-treated and Pyrvinium (Pyr)-treated Meta4 cells (A) and subpopulation-matched cluster overlay (B). (C) PANTHER gene ontology classification results based on top 300 differentially expressed genes in DMSO-treated and Pyr-treated Meta4 cells. (D and E) Clusters of dysplastic stem cells (DSCs), differentiated cells or damaged cells in a superimposed UMAP plot (D) and their proportions in DMSO-treated and Pyr-treated Meta4 samples (E). (F) Volcano plot of genes downregulated or upregulated in Pyr-treated vs DMSO-treated Meta4 cells. (G and H) STAT3-target genes upregulated (Fosb, Fos, and Jun) (G) or downregulated (Dusp4, Ddit3, and Areg) genes (H) in a superimposed UMAP plot. (I) FACS analysis of 7-AAD and annexin V expression in DMSO-treated and Pyr-treated Meta4 organoids. (J) Quantitative real time-PCR analysis showing relative expression of DSC markers, CD133 and CD166, in DMSO-treated vs Pyr-treated Meta4 organoids. (K) FACS analysis of the CD133 and CD166 positive cells in DMSO-treated and Pyr-treated Meta4 organoids. Mean ± standard deviation. Two-tailed Mann-Whitney test.
