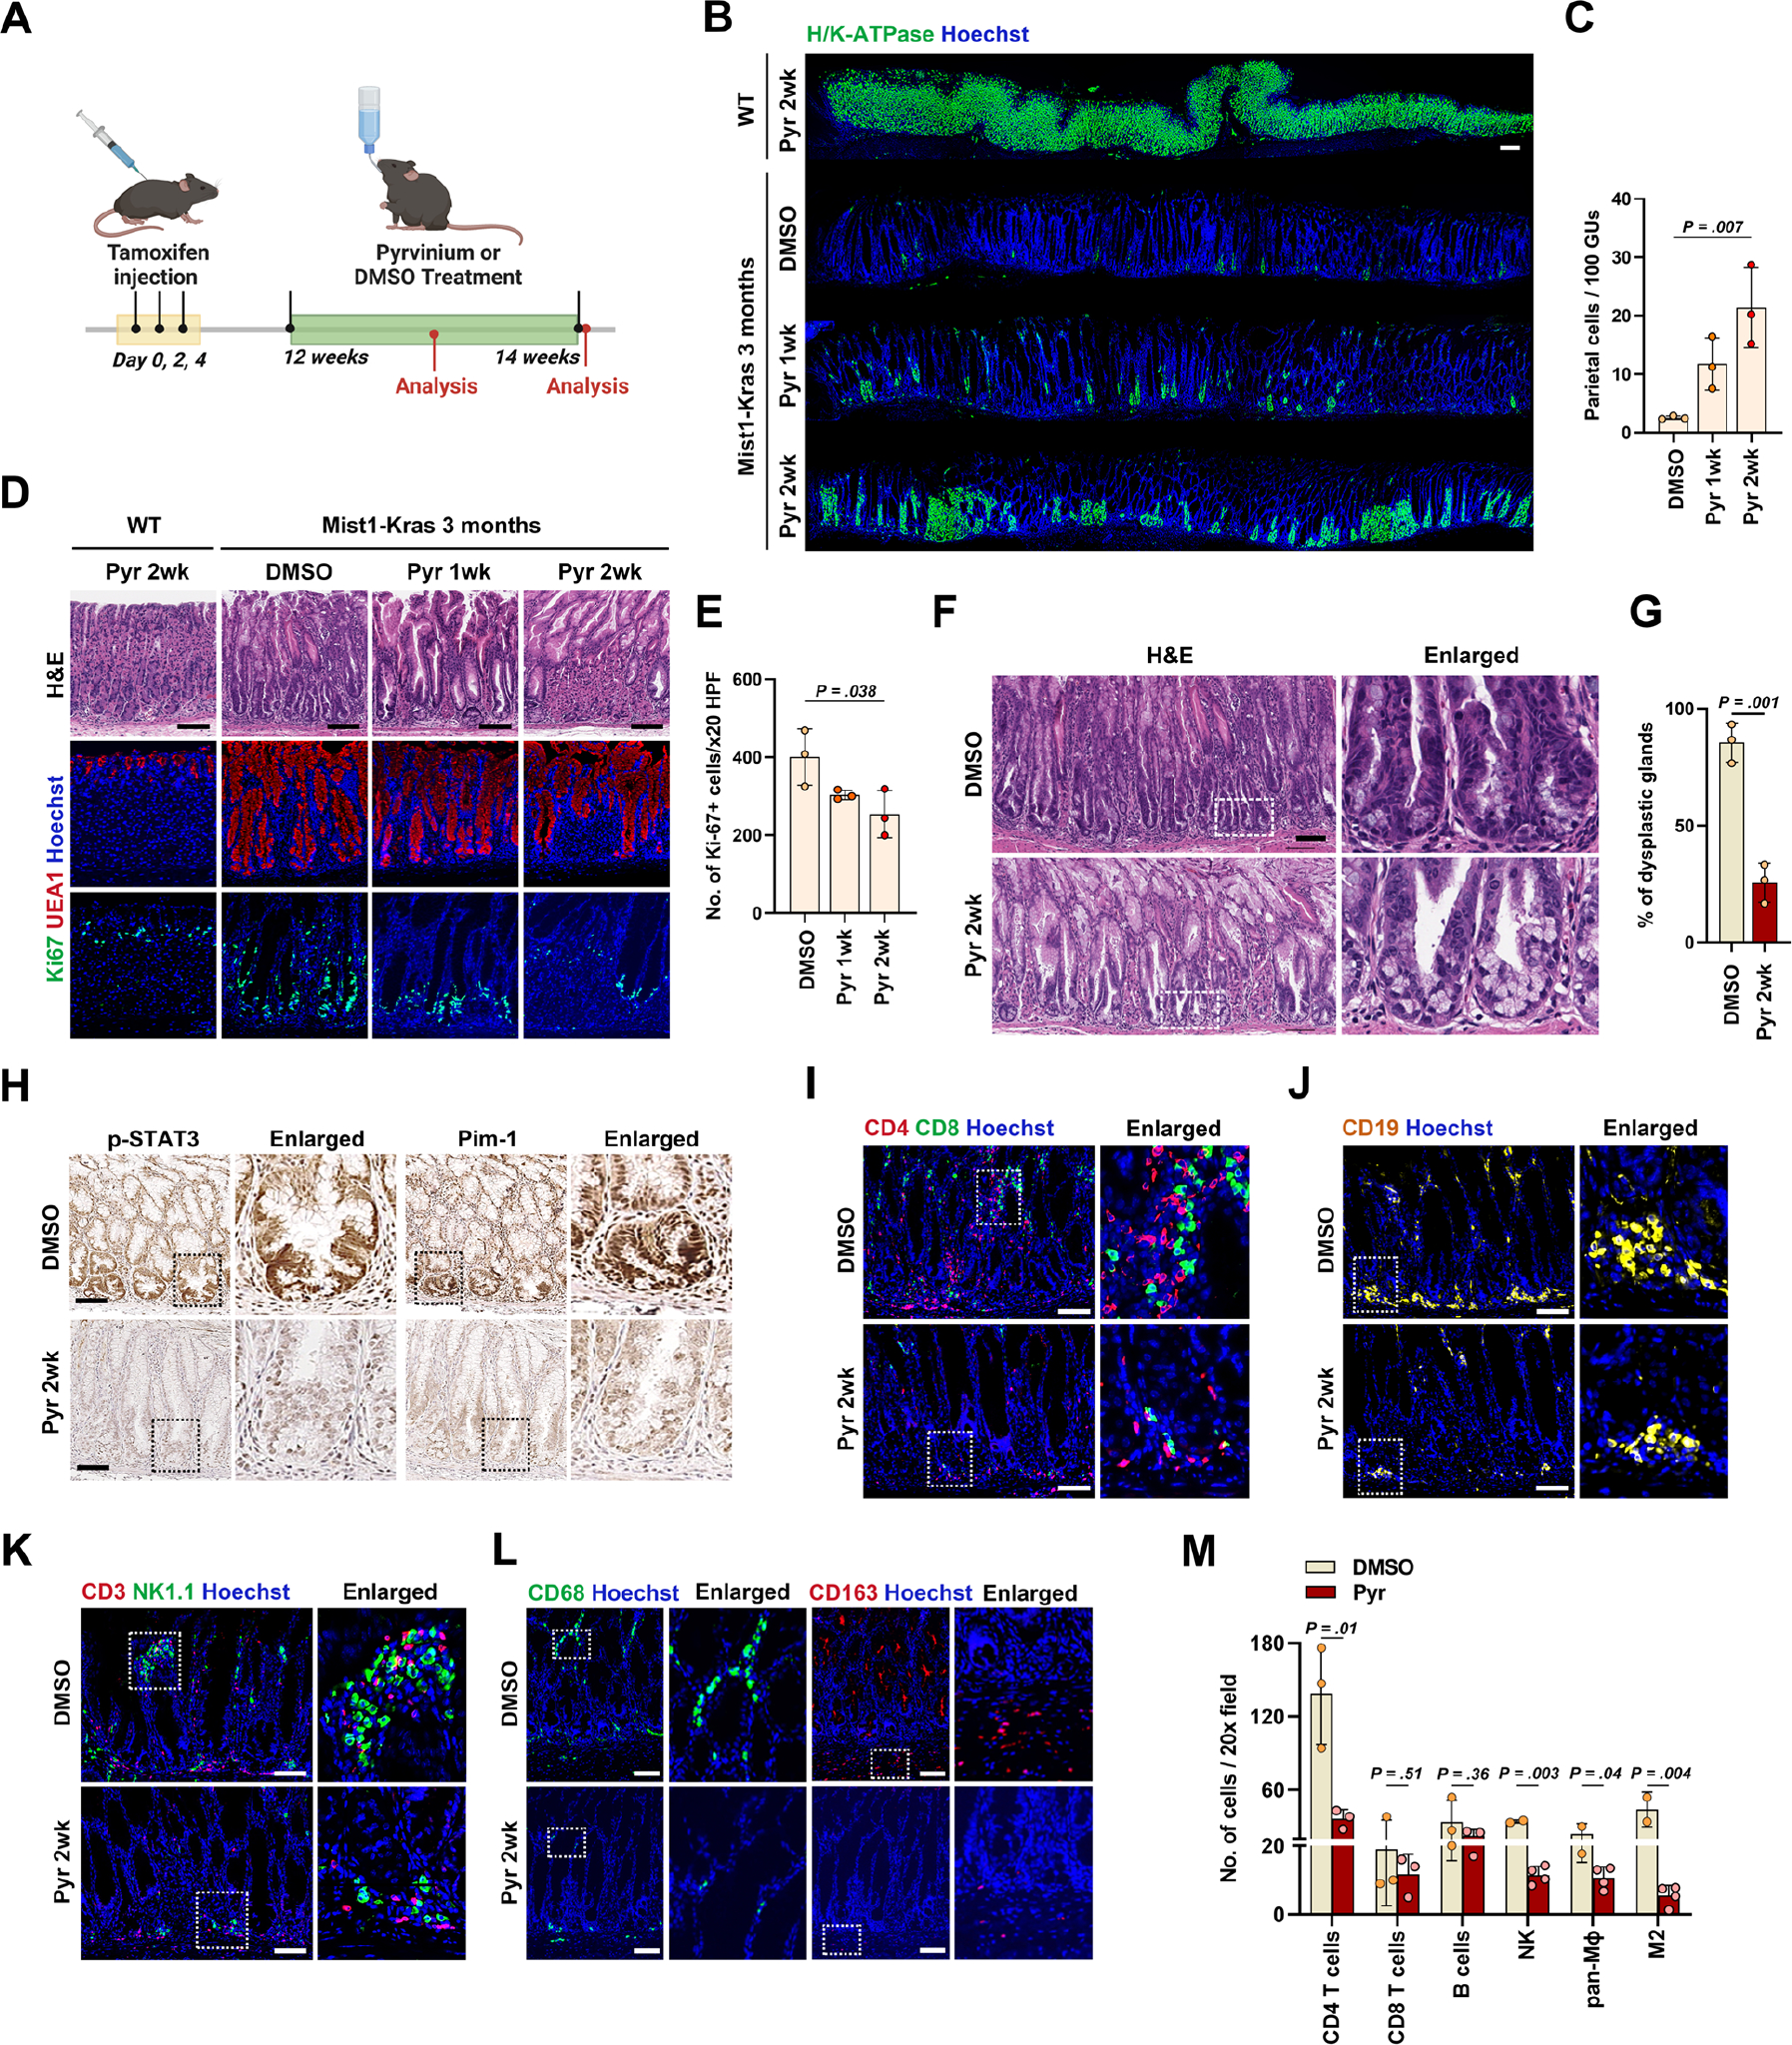
Figure 5. Pyrvinium treatment inhibits metaplasia progression to dysplasia in vivo.

(A) Experimental scheme of Pyrvinium (Pyr) treatment in the Mist1-Kras mice at 3 months after Tamoxifen injection created with BioRender.com. (B) Panoramic view of immunostaining for H/K-ATPase in gastric corpus from wild type mice treated with Pyr for 2 weeks and Mist1-Kras mice treated with DMSO, Pyr for 1 week or 2 weeks. (C) Quantitation of parietal cell-containing gastric units (GUs) per 100 GUs. (D) H&E (top) and immunostaining for UEA1 (middle) and Ki-67 (bottom) in the wild type mice treated with Pyr for 2 weeks and Mist1-Kras mice treated with DMSO or Pyr for 1 or 2 weeks. (E) Quantitation of Ki-67-positive cells per 20X field. (F) Representative H&E images of gastric corpus from Mist1-Kras mice treated with DMSO or Pyr for 2 weeks. (G) Percentages of dysplastic glands in remaining hyperplastic glands. (H) Immunostaining for phospho-STAT3 (p-STAT3) and Pim-1 in gastric corpus from Mist1-Kras mice treated with DMSO or Pyr for 2 weeks. (I and J) Co-immunostaining for CD4 and CD8 (I) and immunostaining for CD19 (J) in the gastric corpus from Mist1-Kras mice treated with DMSO or Pyr for 2 weeks. (K and L) Co-immunostaining for CD3 and NK1.1 (K) and CD68 or CD163 (L) in the gastric corpus from Mist1-Kras mice treated with DMSO or Pyr for 2 weeks. (M) Quantitation of various immune cells per 20X field in Mist1-Kras mice treated with DMSO or Pyr. Mean ± standard deviation. Unpaired t-test or one-way ANOVA with Tukey’s multiple comparisons. Scale bar = 100 μm.
