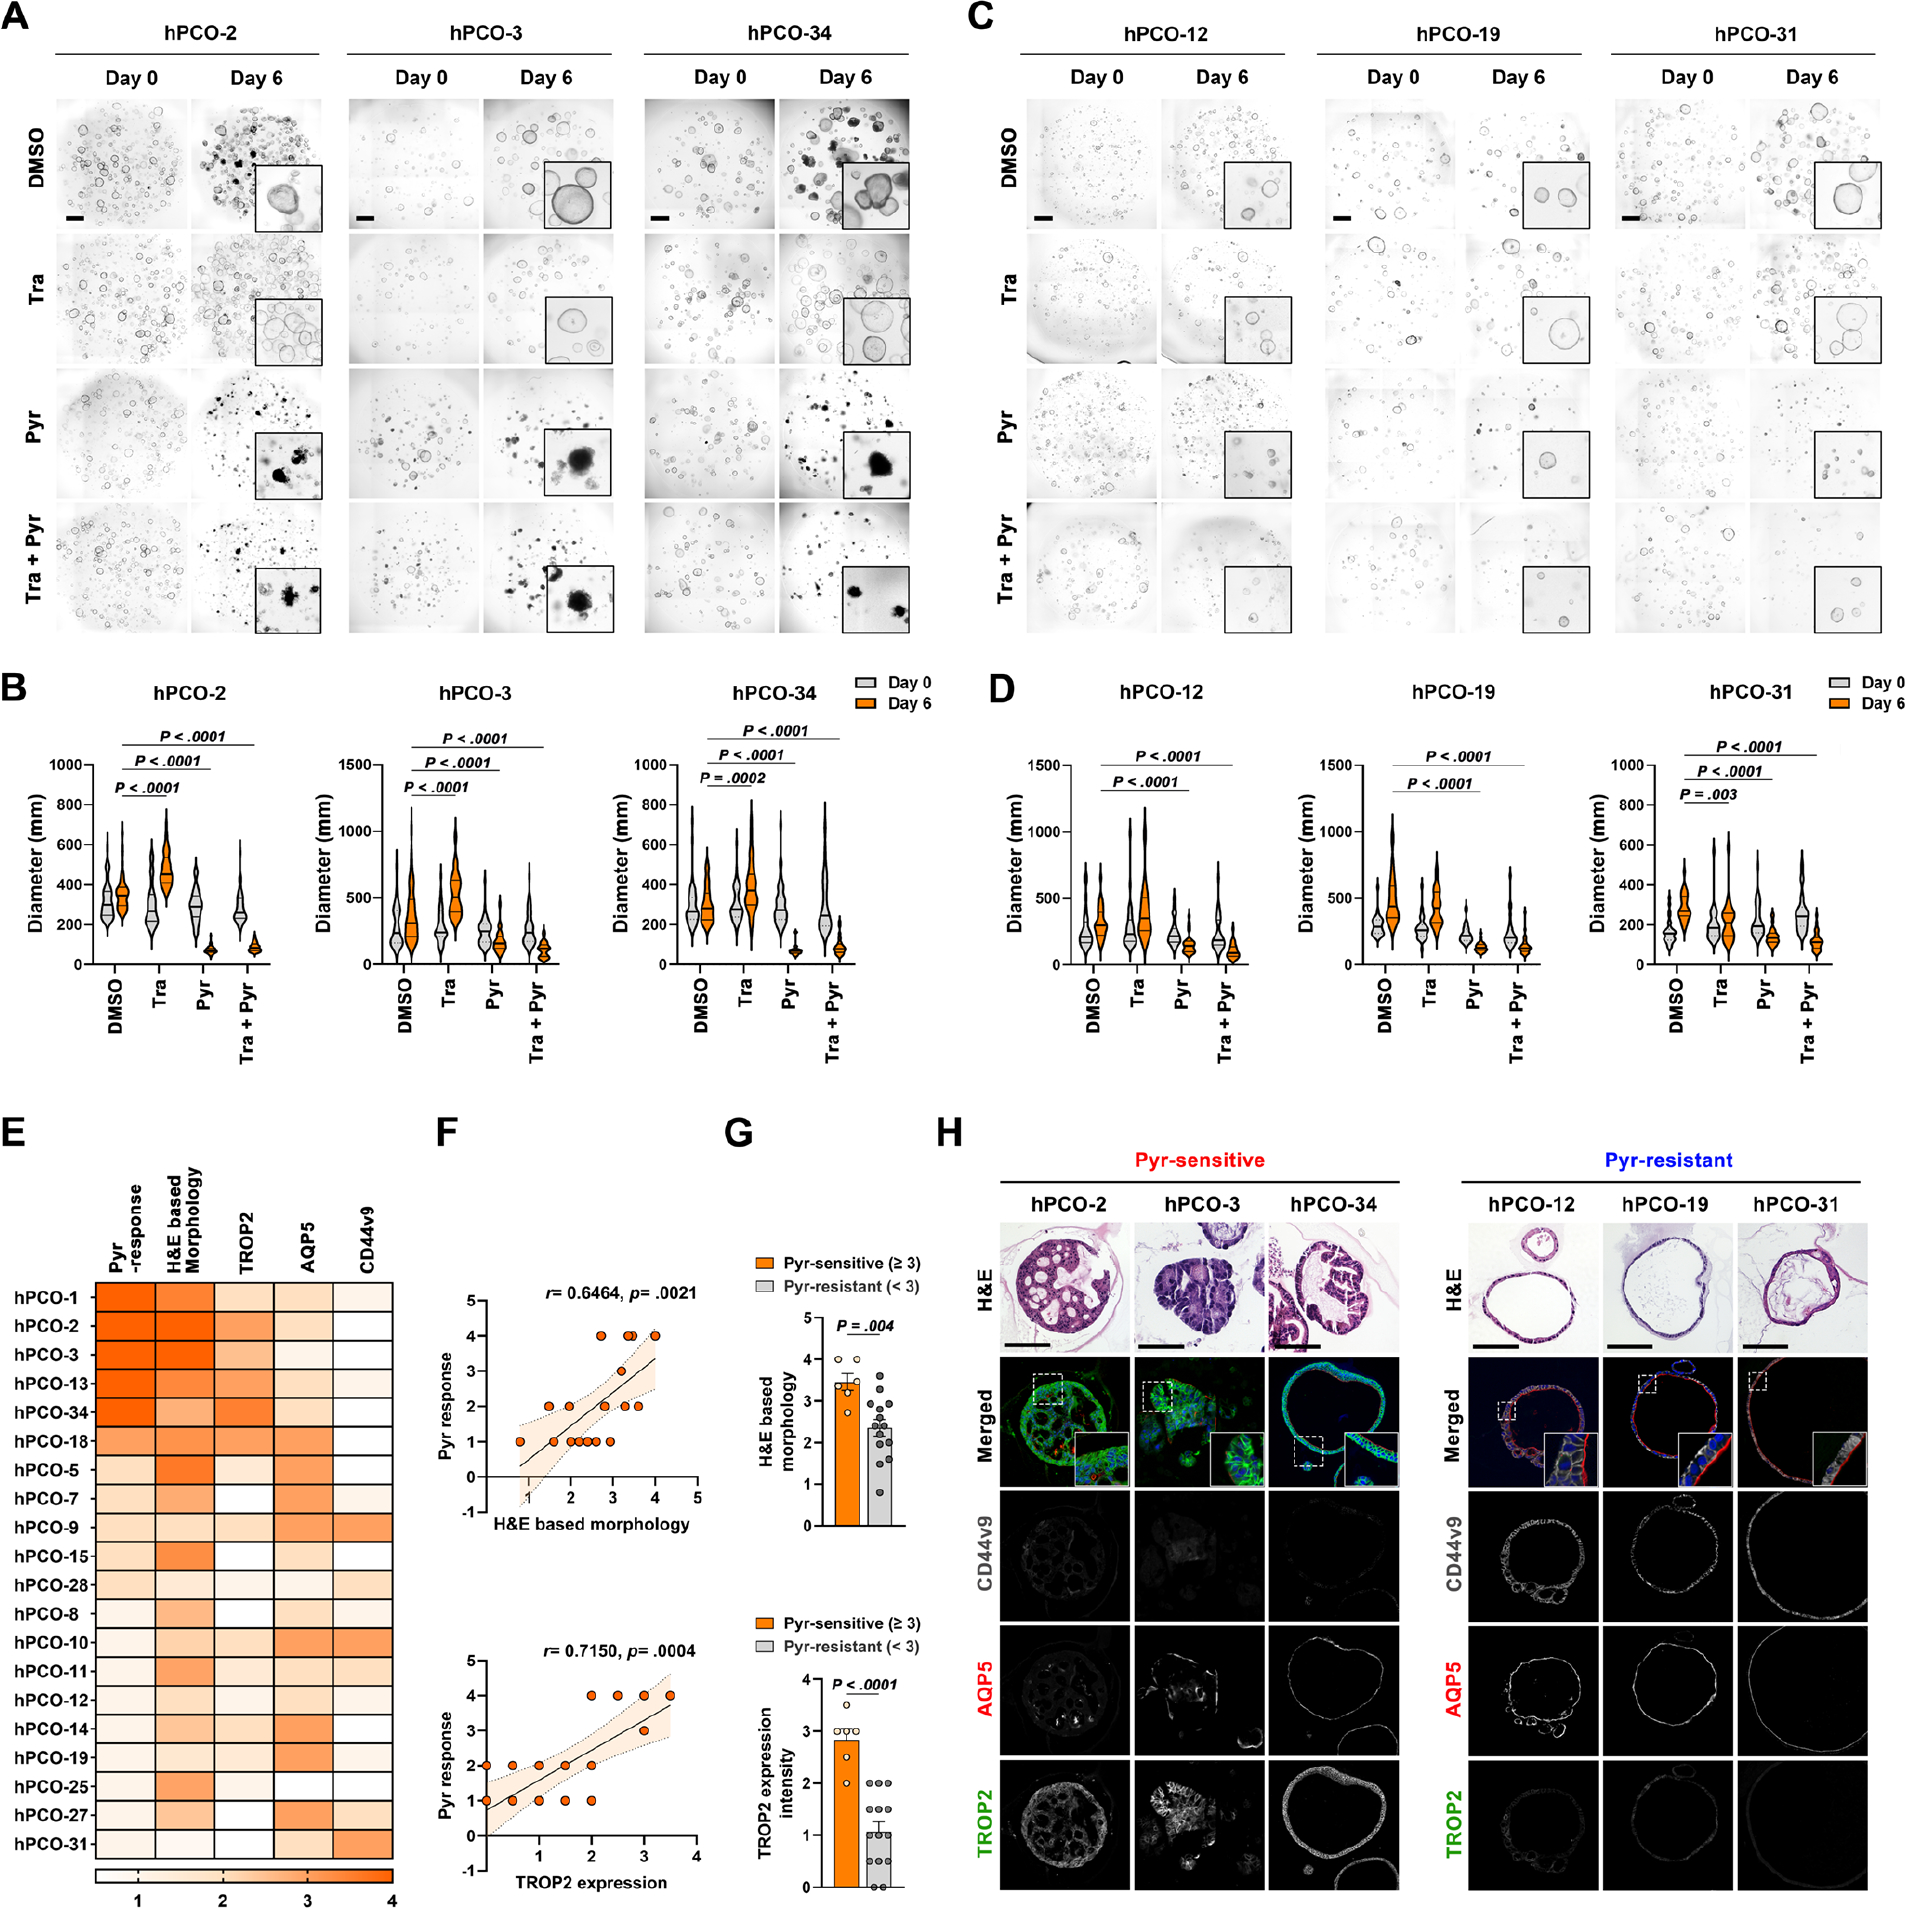
Figure 6. Pyrvinium targets human pre-cancerous organoid (hPCO) with dysplastic features.

(A and B) Representative phase-contrast images of three Pyrvinium (Pyr)-sensitive hPCO lines treated with DMSO, 1uM of Trametinib (Tra), 100nM of Pyrvinium and their combinations for 6 days (A) and quantitation of organoid diameters before and after treatment (B). (C and D) Phase-contrast images of three Pyr-resistant hPCO lines treated with DMSO, 1uM of Trametinib (Tra), 100nM of Pyrvinium and their combinations for 6 days (C) and quantitation of organoid diameters before and after treatment (D). (E) Heatmap displaying Pyr response, morphology, and expression of TROP2, AQP5, and CD44v9 in twenty hPCO lines. (F) Correlation graphs of Pyr response with morphology and TROP2 expression in hPCO lines. (G) Bar graphs showing morphology or TROP2 expression scores between Pyr-sensitive and – resistant hPCO lines. (H) Representative H&E images and co-immunostaining for CD44v9, AQP5, and TROP2 in three Pyr-sensitive and -resistant hPCO lines. Mean ± standard deviation. Spearman’s correlation coefficient, unpaired t-test or Two-way ANOVA with Tukey’s multiple comparisons. Scale bar = 500 μm.
