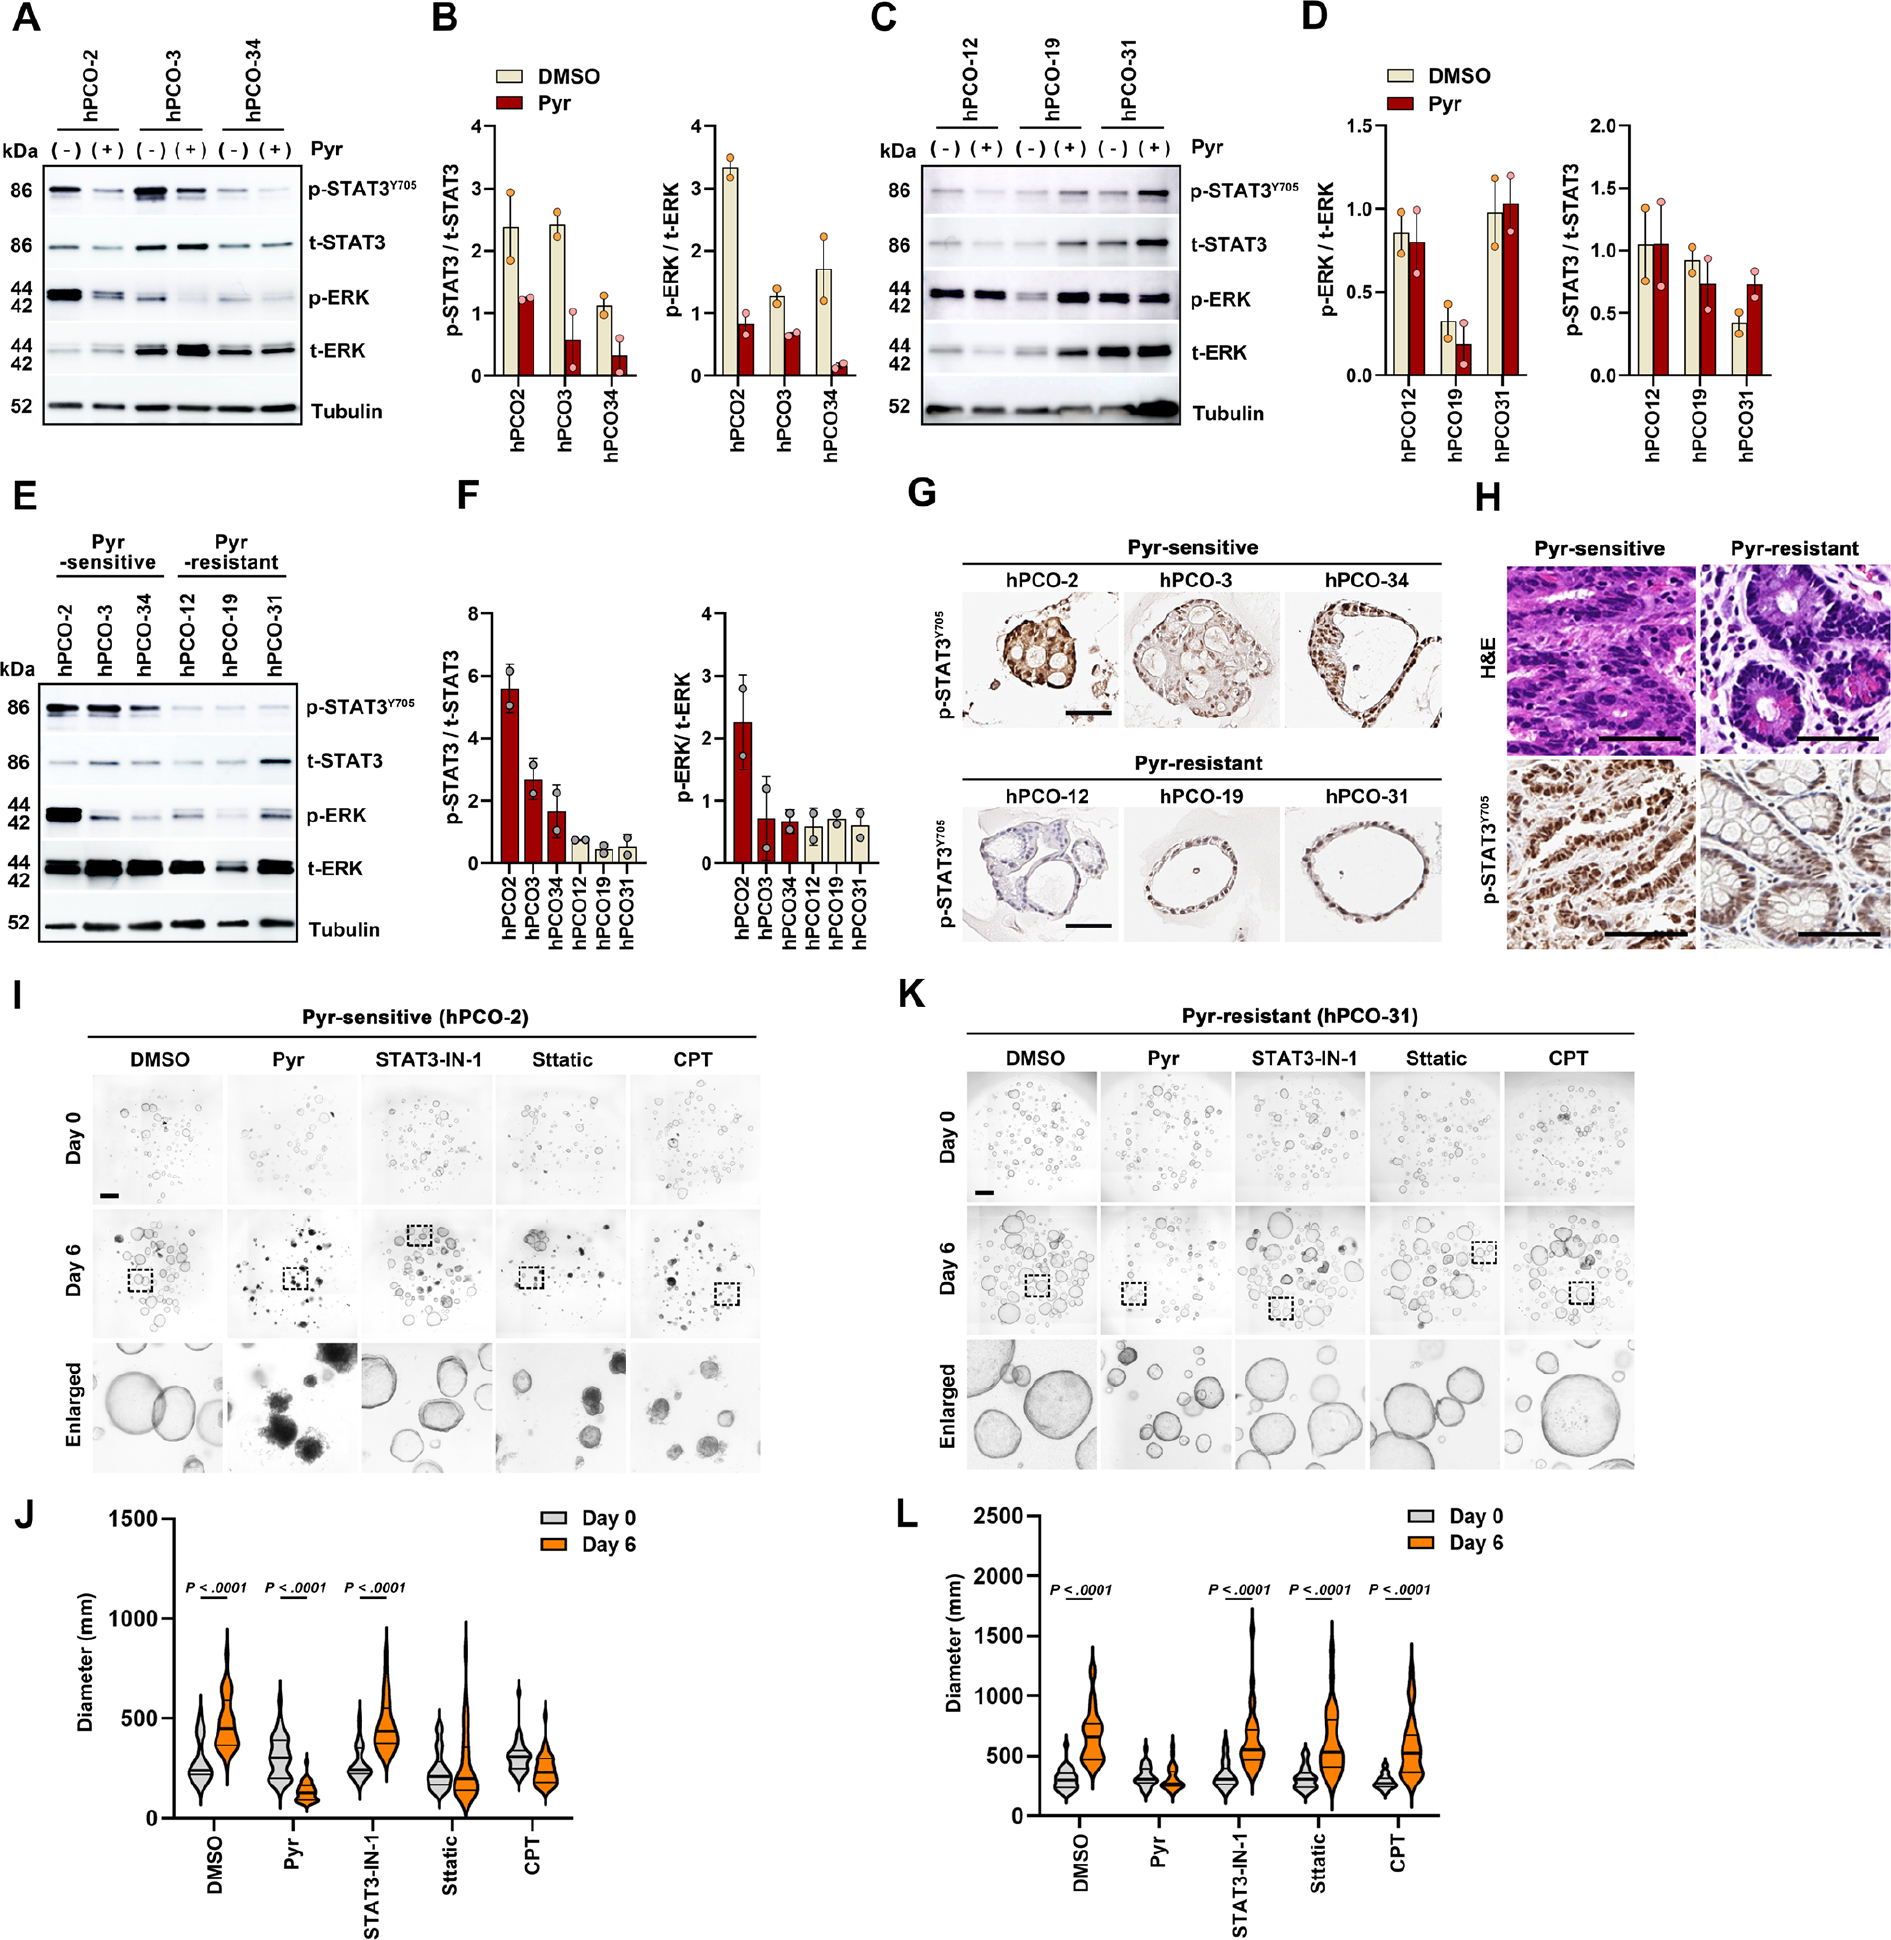
Figure 7. Pyrvinium induces the cell death in dysplastic human pre-cancerous (hPCO) organoids by blocking ERK and STAT3 signaling pathways.

(A and B) Western blot analysis for p-STAT3 and p-ERK in three Pyr-sensitive hPCO lines after Pyr treatment (A), and ratios of p-STAT3/total STAT3 (t-STAT3) and p-ERK/total ERK (t-ERK) (B). (C and D) Western blot for p-STAT3 and p-ERK in three Pyr-resistant hPCO lines after Pyr treatment (C) and ratios of p-STAT3/t-STAT3 and p-ERK/t-ERK (D). (E and F) Western blot for basal p-STAT3 and p-ERK levels in Pyr-sensitive and -resistant hPCO lines (E), and ratios of p-STAT3/t-STAT3 and p-ERK/t-ERK (F). (G) Representative immunostaining images of p-STAT3 in Pyr-sensitive or – resistant hPCO lines. (H) H&E and p-STAT3 immunostaining images of gastric tissues, used for hPCO line establishment. (I and J) Phase-contrast images of Pyr-sensitive hPCO-2 treated with DMSO, Pyr, STAT3-IN-1, Sttatic, and Cryptotanshinone (CPT) for 6 days (I) and quantitation of organoid diameters before and after treatment (J). (K and L) Phase-contrast images of Pyr-resistant hPCO-31 treated with each drug for 6 days (K) and quantitation of organoid diameters (L). Scale bar = 500 μm. Mean ± standard deviation. Two-way ANOVA (with Tukey test for pairwise comparisons.
