
Figure 3: Low to high-level feature categories predict activity along the lateral surface.
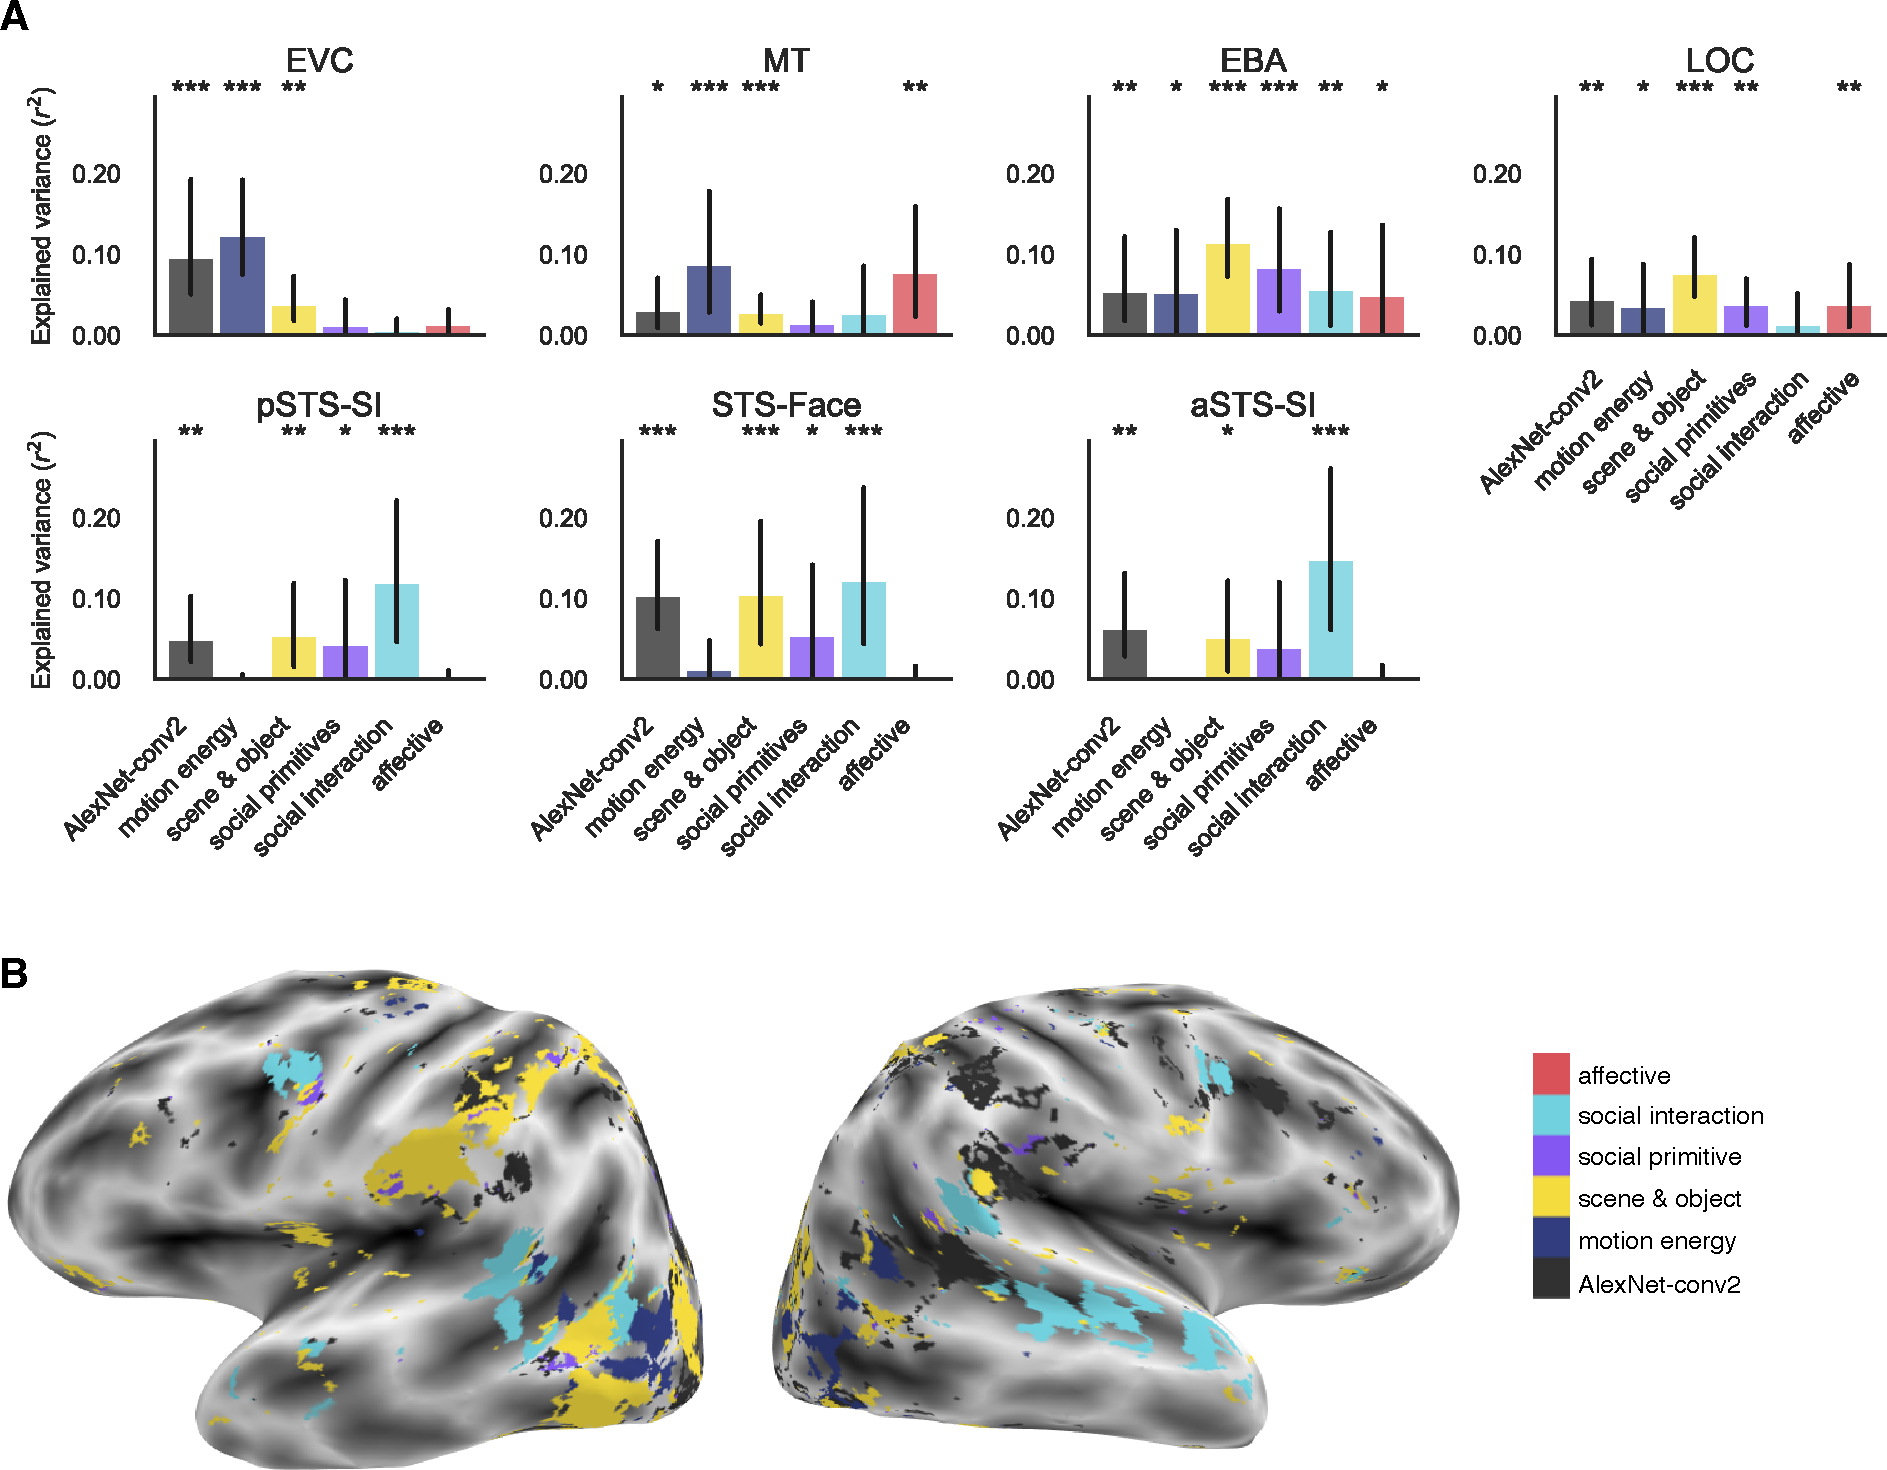
(A) Group-level explained variance by each feature category in each of the lateral ROIs. Individual subject results are shown in Figure S3A and ventral ROI results in Figure 4A–B. Error bars are the bootstrapped 95% confidence intervals. Significance was estimated using permutation testing and FDR corrected: * FDR q < 0.05, ** FDR q < 0.01, *** FDR q < 0.001. (B) Encoding model preference map in one example subject. Voxels are colored by the category with the greatest significant prediction following multiple comparison correction. Other subjects are in Figure S5A–D. See also Figure S4.