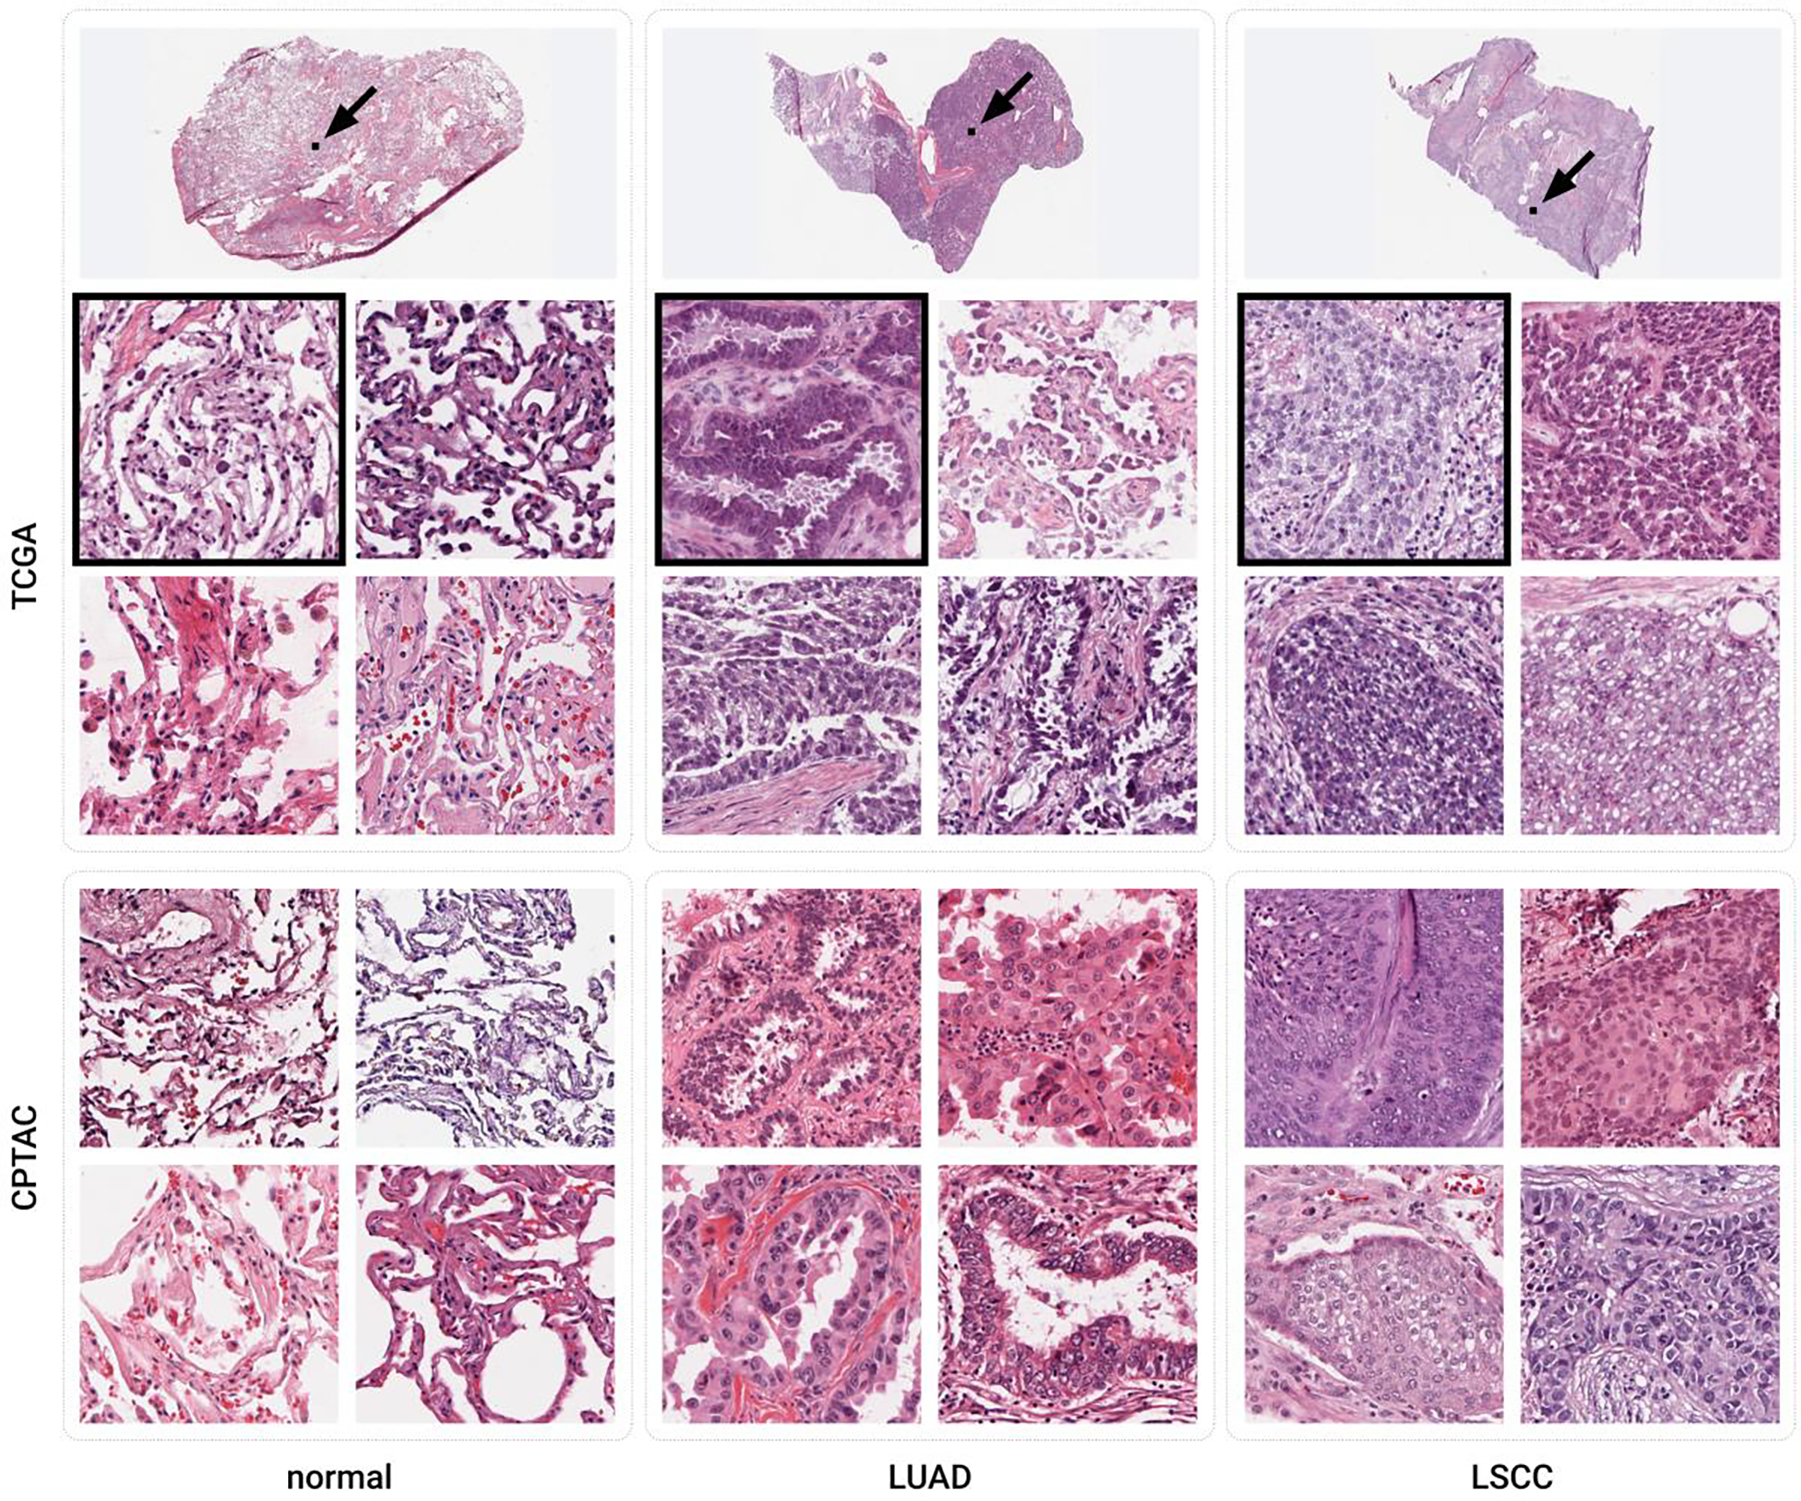
Figure 2:

Example tiles of the three classes considered from the TCGA and CPTAC datasets. The width of each tile is 256 μm. The black boxes marked with arrows in the whole slide images on top show the boundaries of the upper left tiles of the TCGA data set.
