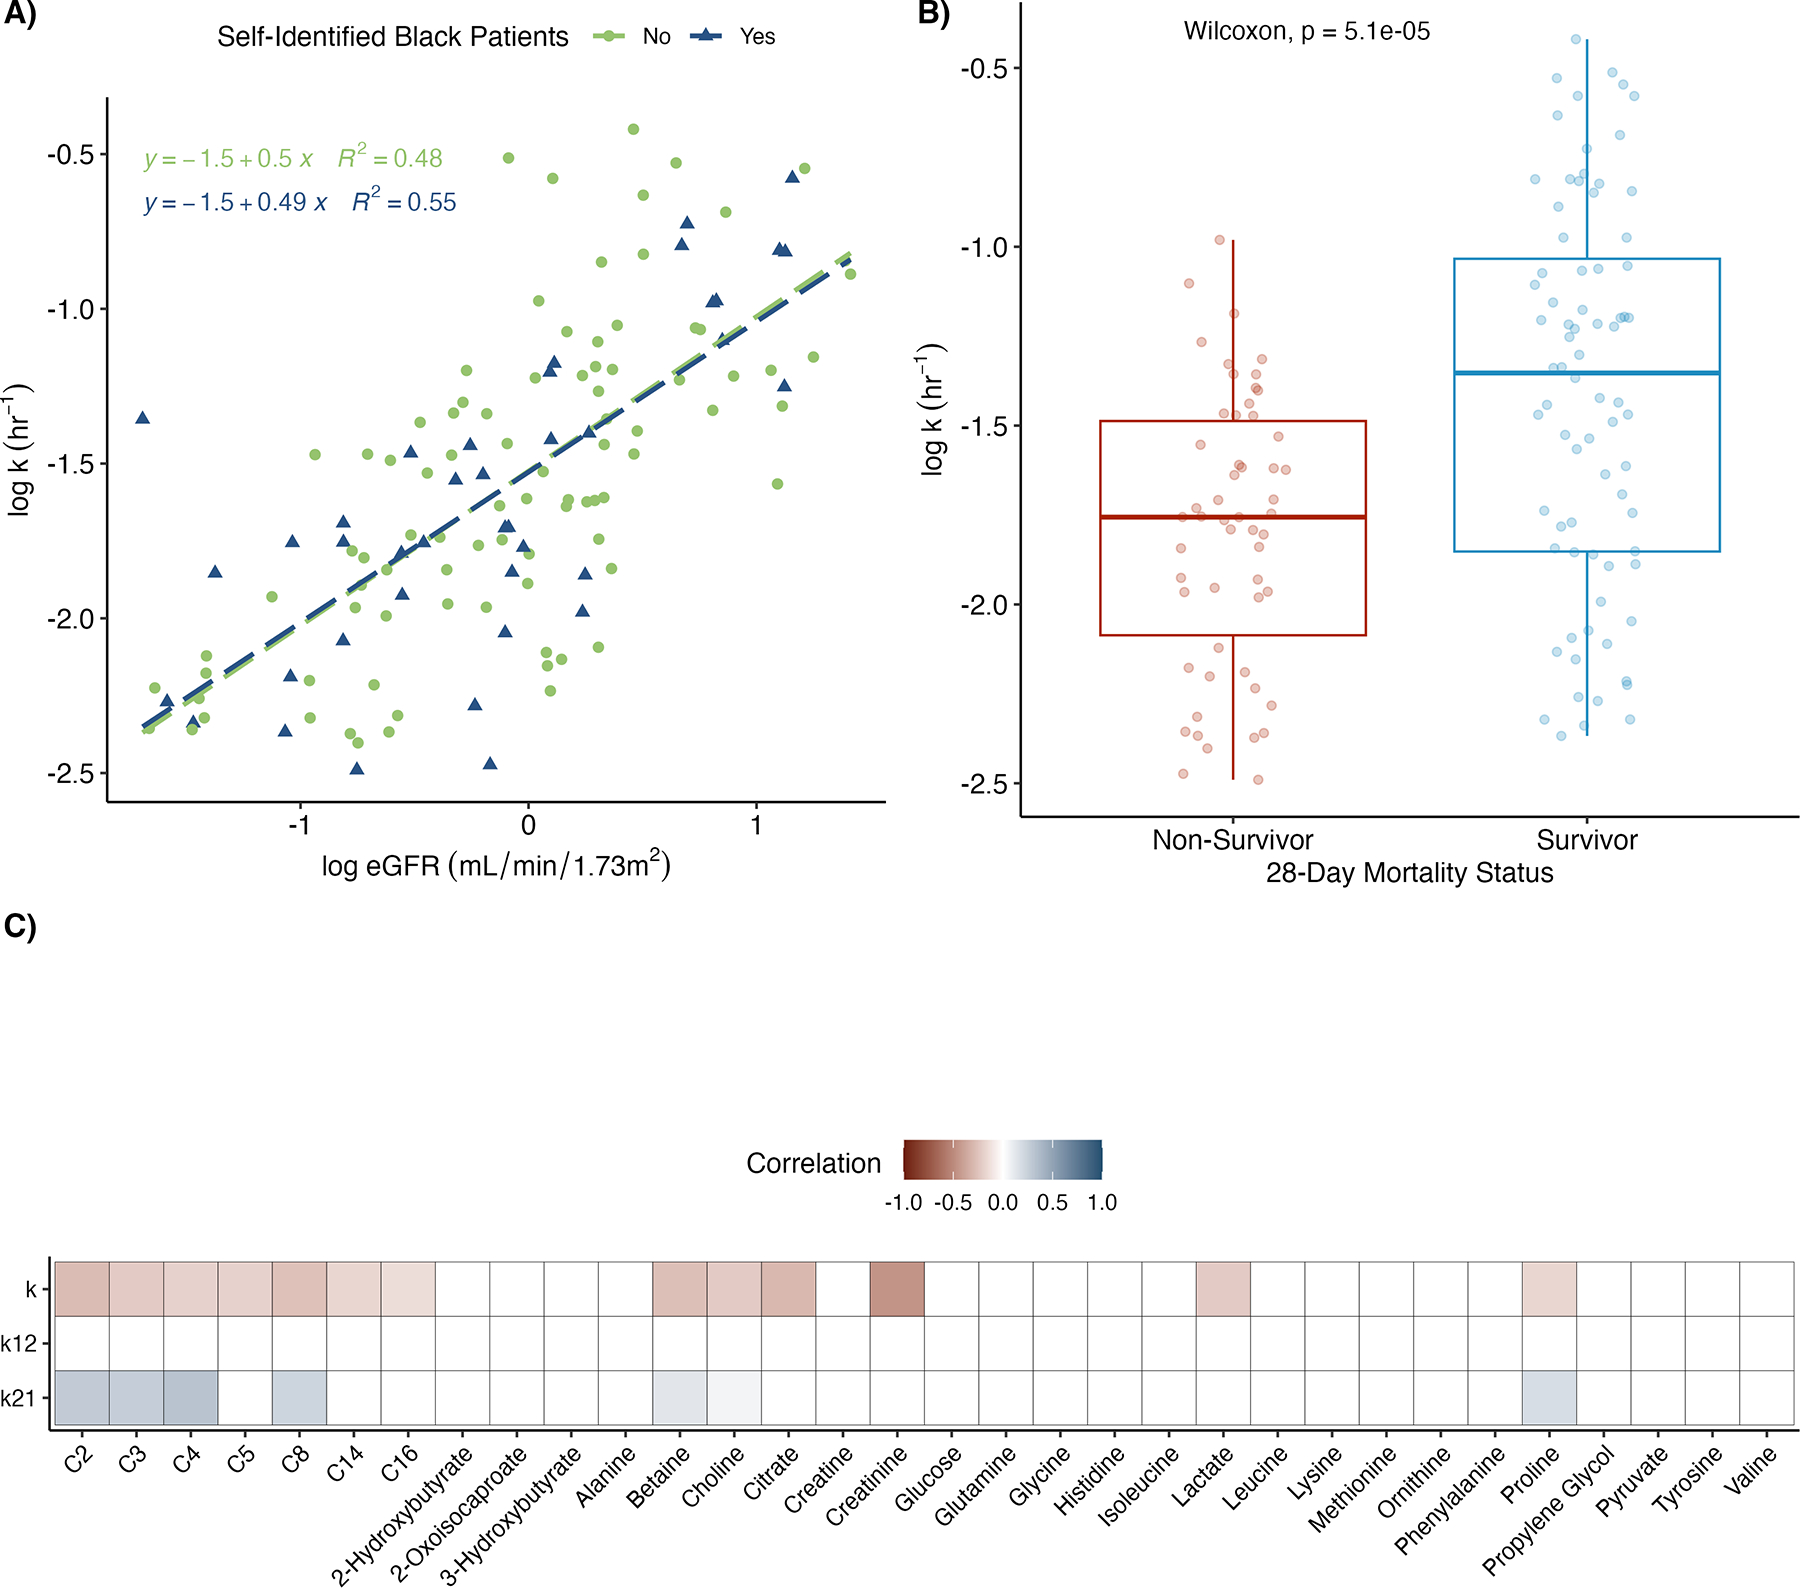
Figure 1. Association of individual patient parameters with patient characteristics.

(A) Scatter plot and line of best fit for the predicted elimination rate constant (k) from the final model versus eGFR. Self-identified black (in blue) and non-black (in green) patients are plotted separately. eGFR was estimated using the 2021CKD-EPI equation with serum creatinine and cystatin c. Patient parameters were log-transformed prior to plotting. (B) Boxplots of estimated elimination rate constant (k) stratified by 28-day mortality status. (C) Heatmap of Spearman correlation coefficients between conditional mode estimated individual parameters and baseline (pre-treatment) metabolite levels as measured by LC-MS (acylcarnitines, C2-C16) and 1H-NMR spectroscopy. Individual parameters considered were k and rate in-to (k12) and out-of (k21) tissue. eGFR: estimated glomerular filtration rate; CKD-EPI: Chronic Kidney Disease Epidemiology Collaboration; LC-MS: liquid chromatography-mass spectroscopy; 1H-NMR: proton nuclear magnetic resonance.
