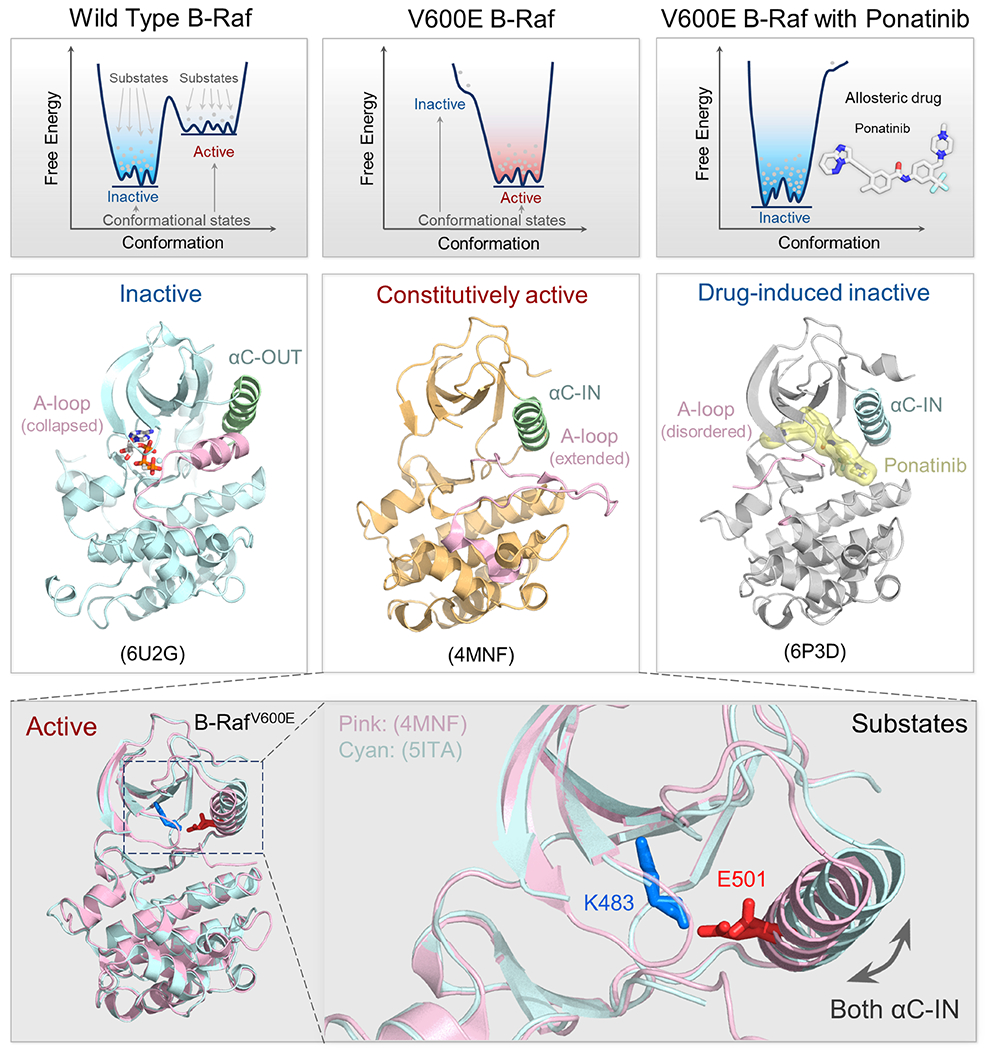
Figure 2.

Illustration of the conformational states and substates of wild-type B-Raf, B-RafV600E, and allosterically inhibited B-RafV600E. Dynamic free energy landscapes and structures of B-Raf, B-RafV600E, and ponatinib bound B-RafV600E (top panels). The free energy shows the distribution and population of protein states. Each well represents a distinct conformational state (active or inactive), with the depth of the well indicating the stability of the state. Within each well, multiple dots indicate the population of substates that a protein can adopt. The barriers between these substates are lower than the barriers separating different conformational states. In the left column, wide type B-Raf primarily adopts an inactive state; in the middle column, B-RafV600E primarily shows an active state; in the right column, B-RafV600E bound to an allosteric drug ponatinib which disrupts its ability to phosphorylate, resulting in population shift towards the inactive state. Their predominant structures are shown below their respective free energy landscape plots (middle panels). Note that the V600E mutation shifts the relative stability of the protein from favoring the inactive state to the active state. We annotate the PDB code in each panel for reference. Within each conformational state, the protein can adopt a range of substates (bottom panels). For example, active B-RafV600E shows structural variations in the position of the αC helix. The important salt bridge between K483-E501 represents a key feature of the active protein kinase conformation.
