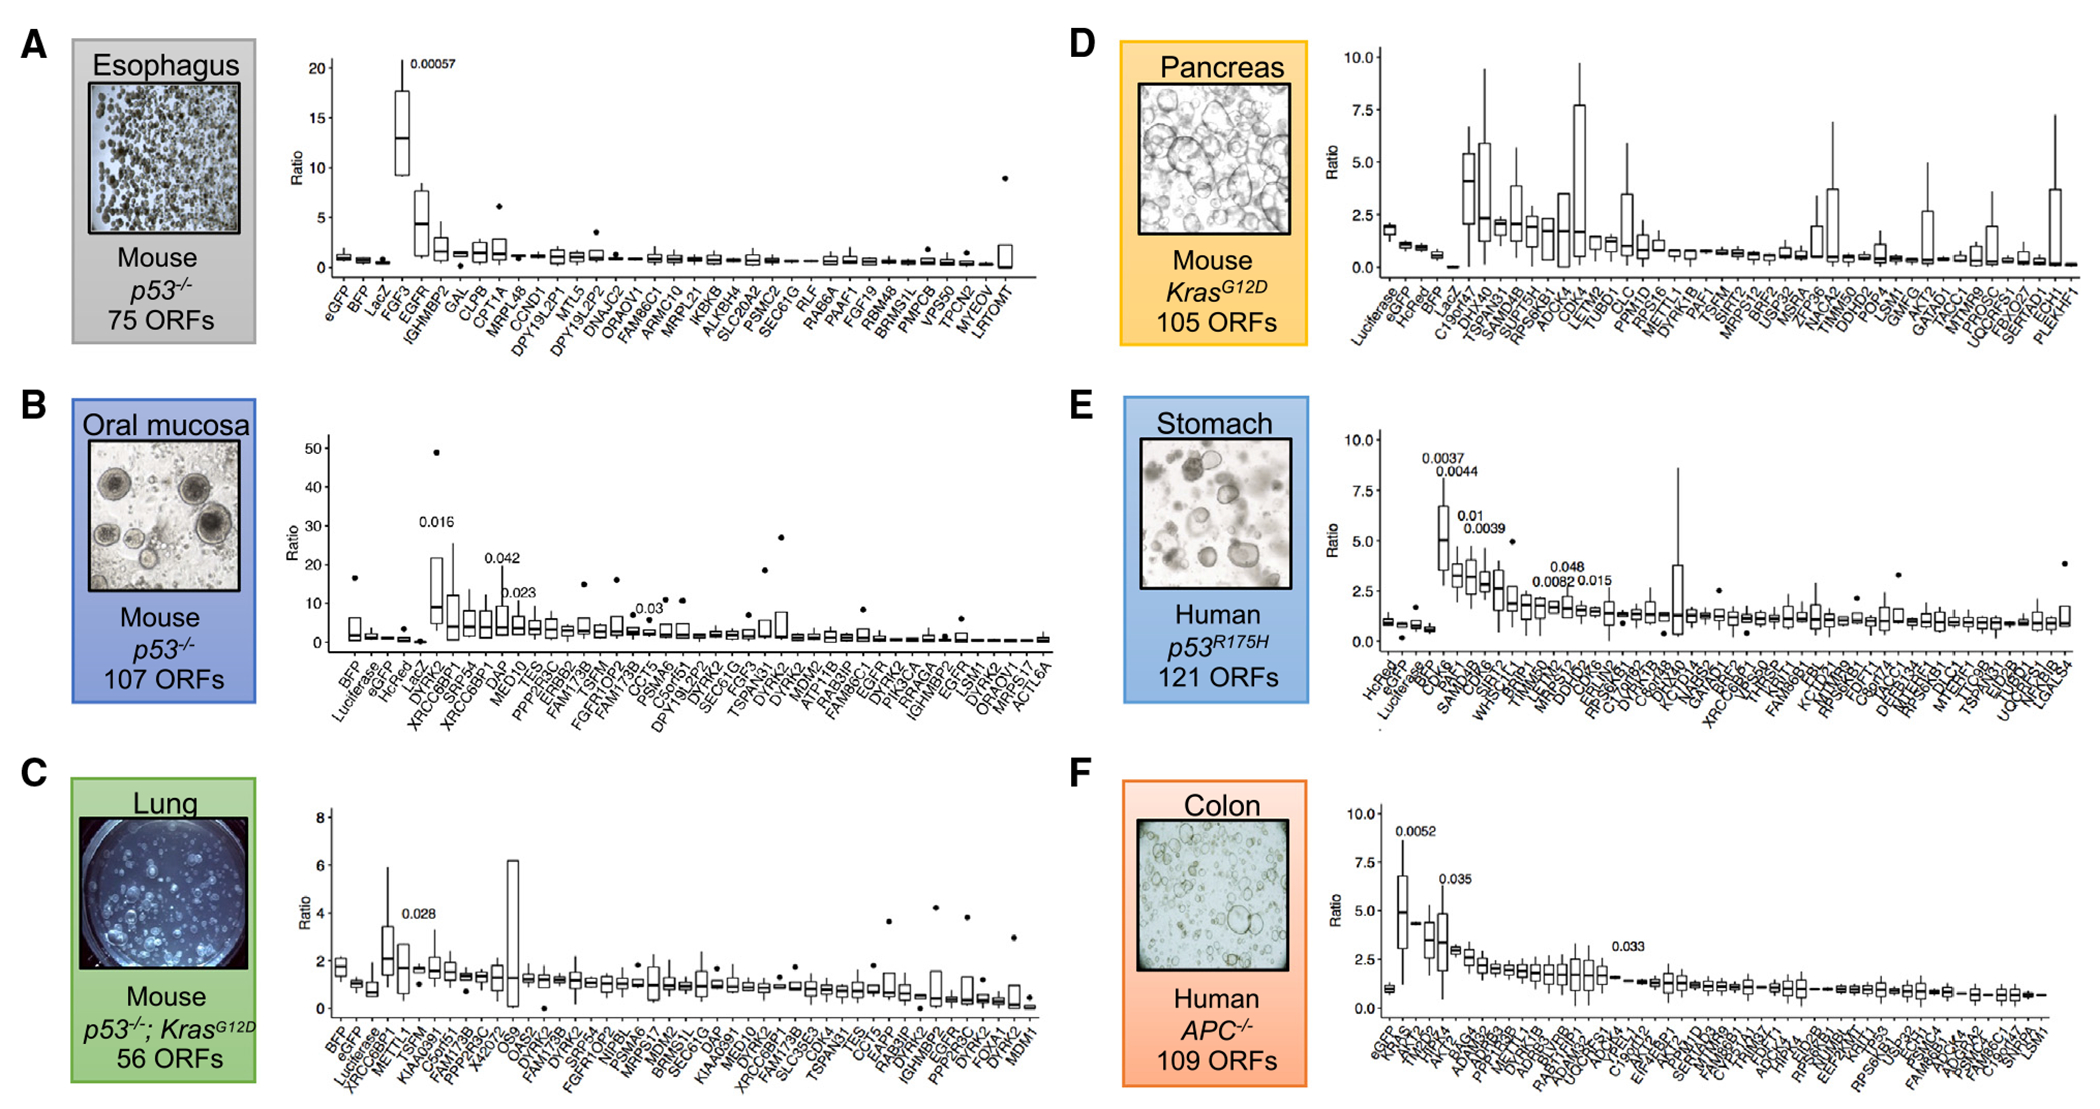
Figure 3. Screening pan-cancer candidate amplification outliers in organoids with corresponding tissue context.

(A–F) Barcode ratios of terminal:initial time points from NGS demonstrating relative enrichments from pooled lentiviral ORF screens. Boxplots represent four technical replicates with the exception of (F), which was performed with two technical replicates. Terminal time points are as follows: A = day 53, B = day 52, C = day 32, D = day 50, E = day 55, and F = day 56.
