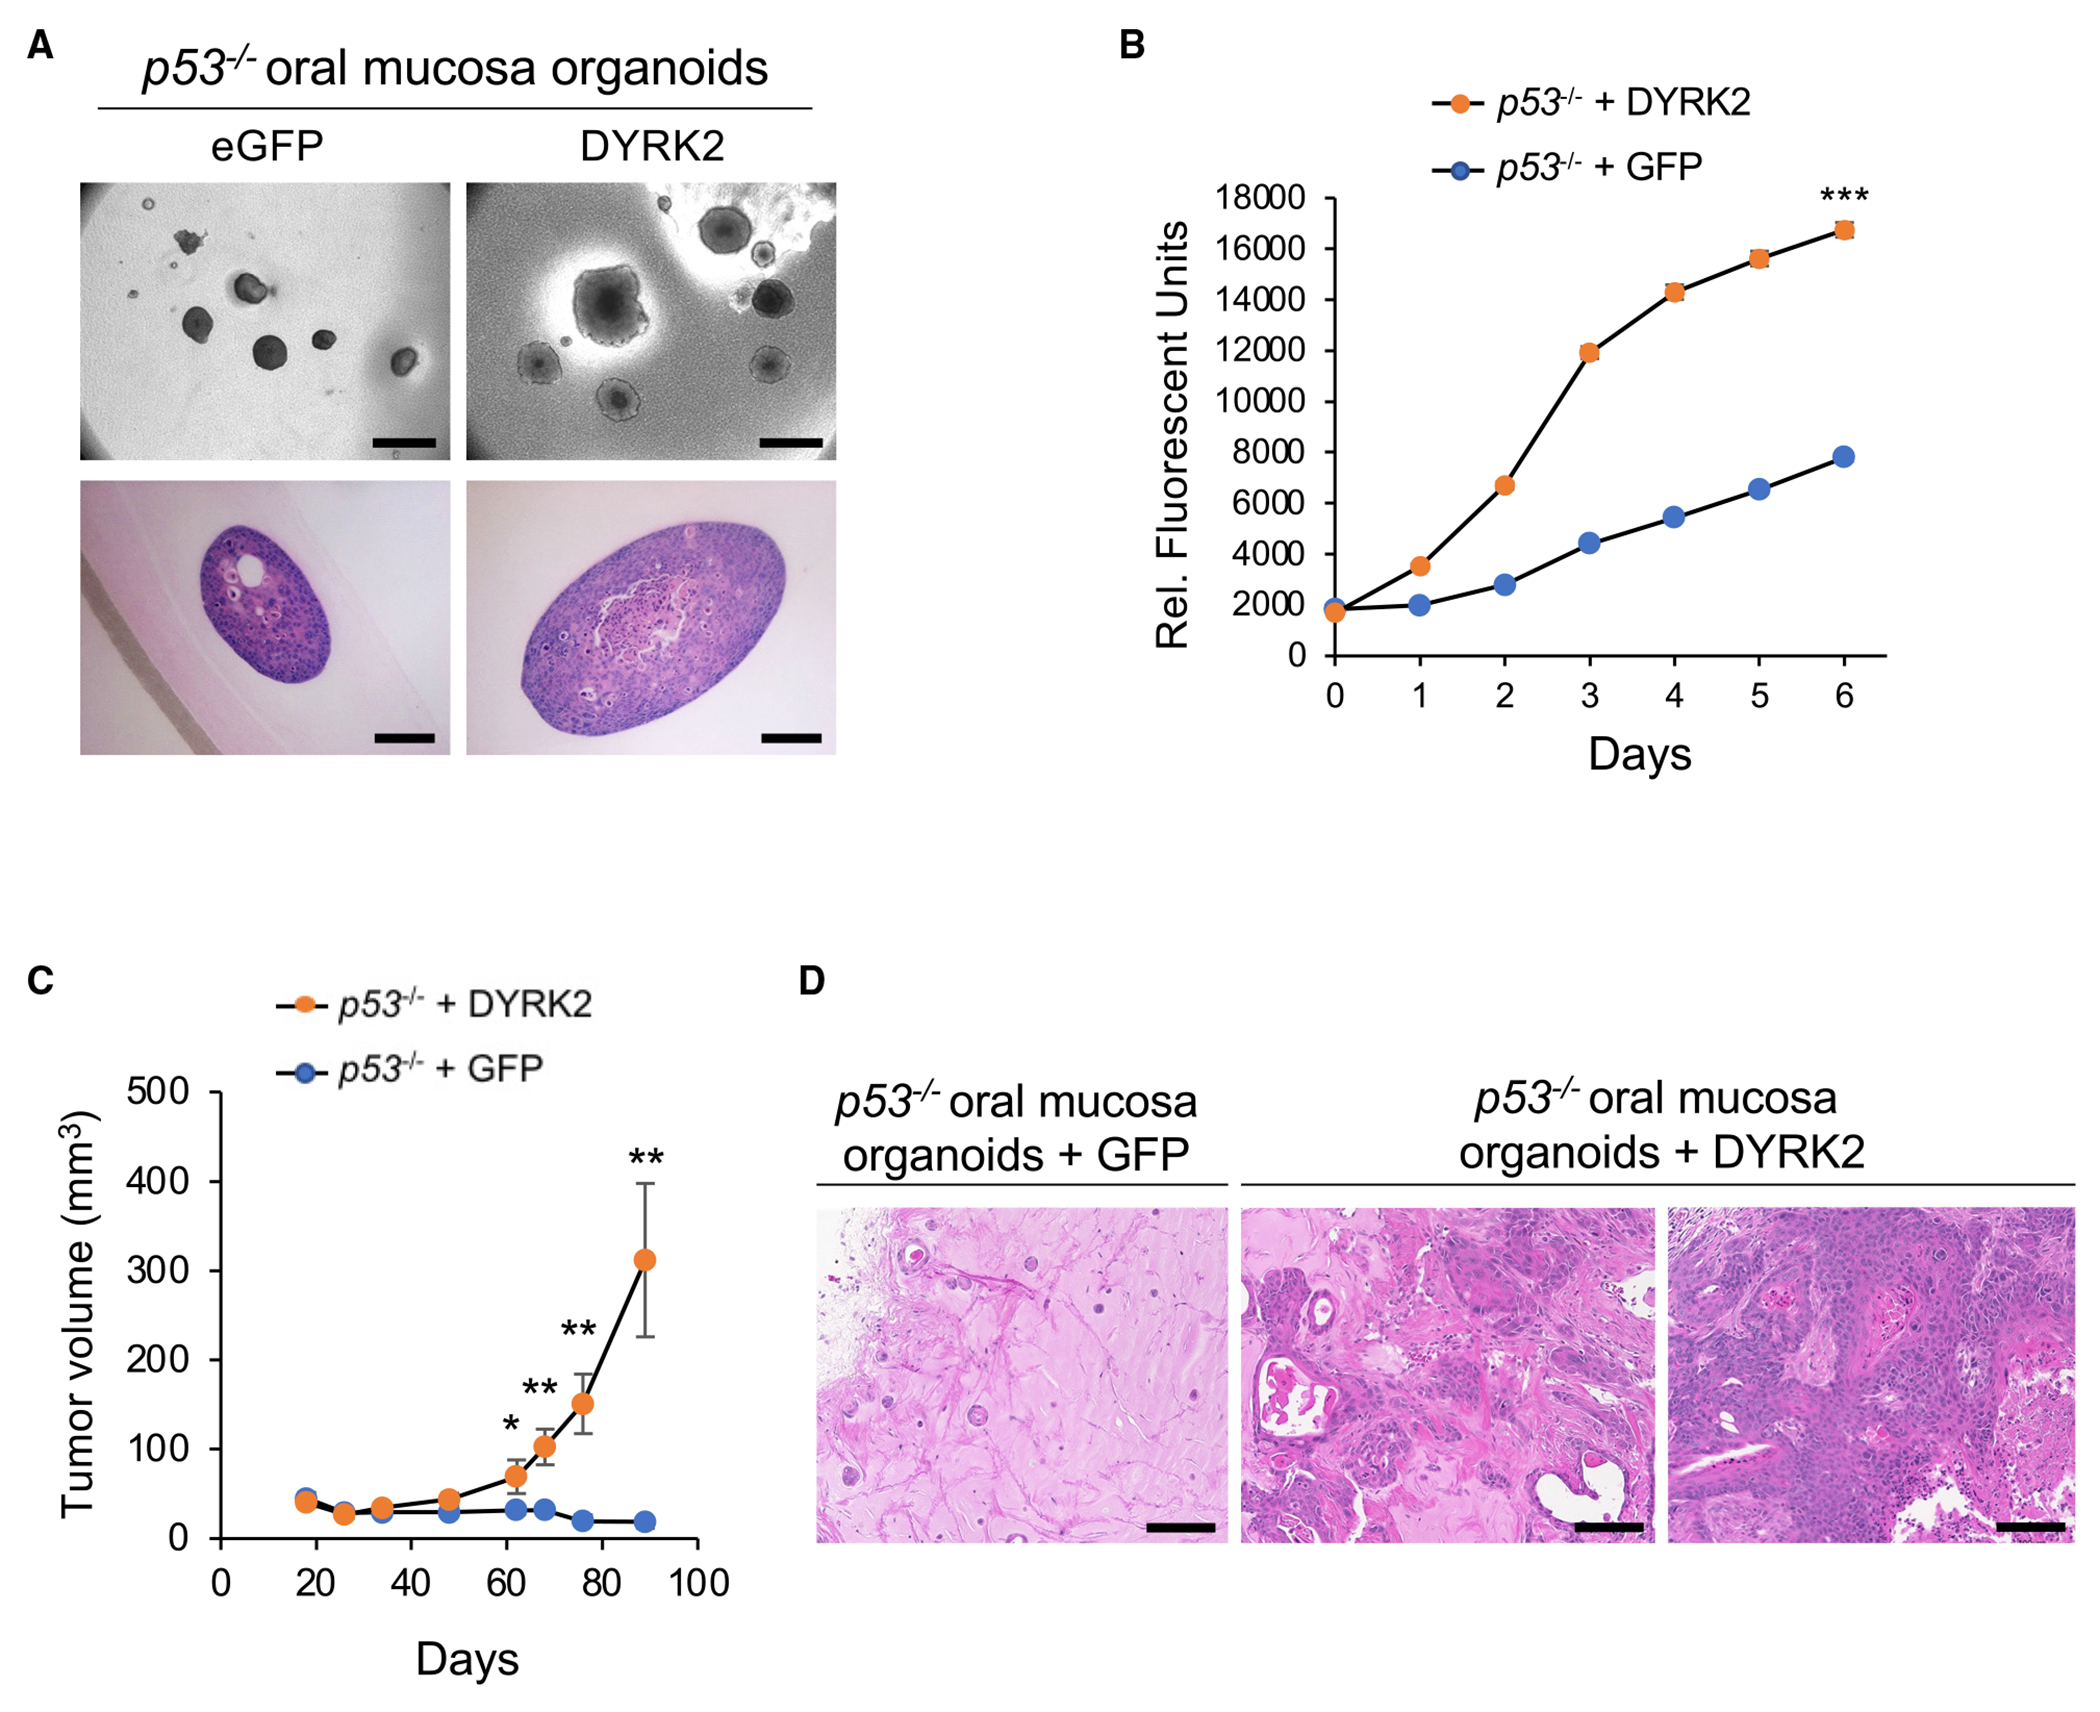
Figure 4. DYRK2 and FGF3 overexpression induces proliferation and tumorigenicity of p53−/− mouse oral mucosa and esophageal organoids, respectively.

(A) Morphology of p53−/−; eGFP and p53−/−; DYRK2 organoids cultured in ALI for 14 days. Scale bar: bright field; 500 μm (top panel), H&E staining; 100 μm (bottom panel).
(B) In vitro proliferation of p53−/−; eGFP and p53−/−; DYRK2 organoids generated from oral mucosal tissue from a different donor mouse in ALI assessed by resazurin reduction. Data represent mean ± SEM. ***p < 0.001, two-tailed Student’s t test.
(C) Tumor volume of p53−/−; eGFP (n = 6) and p53−/−; DYRK2 (n = 7) organoids. Data represent mean ± SEM. *p < 0.05, **p < 0.01, two-tailed Student’s t test.
(D) H&E staining of p53−/−; eGFP and p53−/−; DYRK2 organoid tumors. Scale bar: 100 μm.
