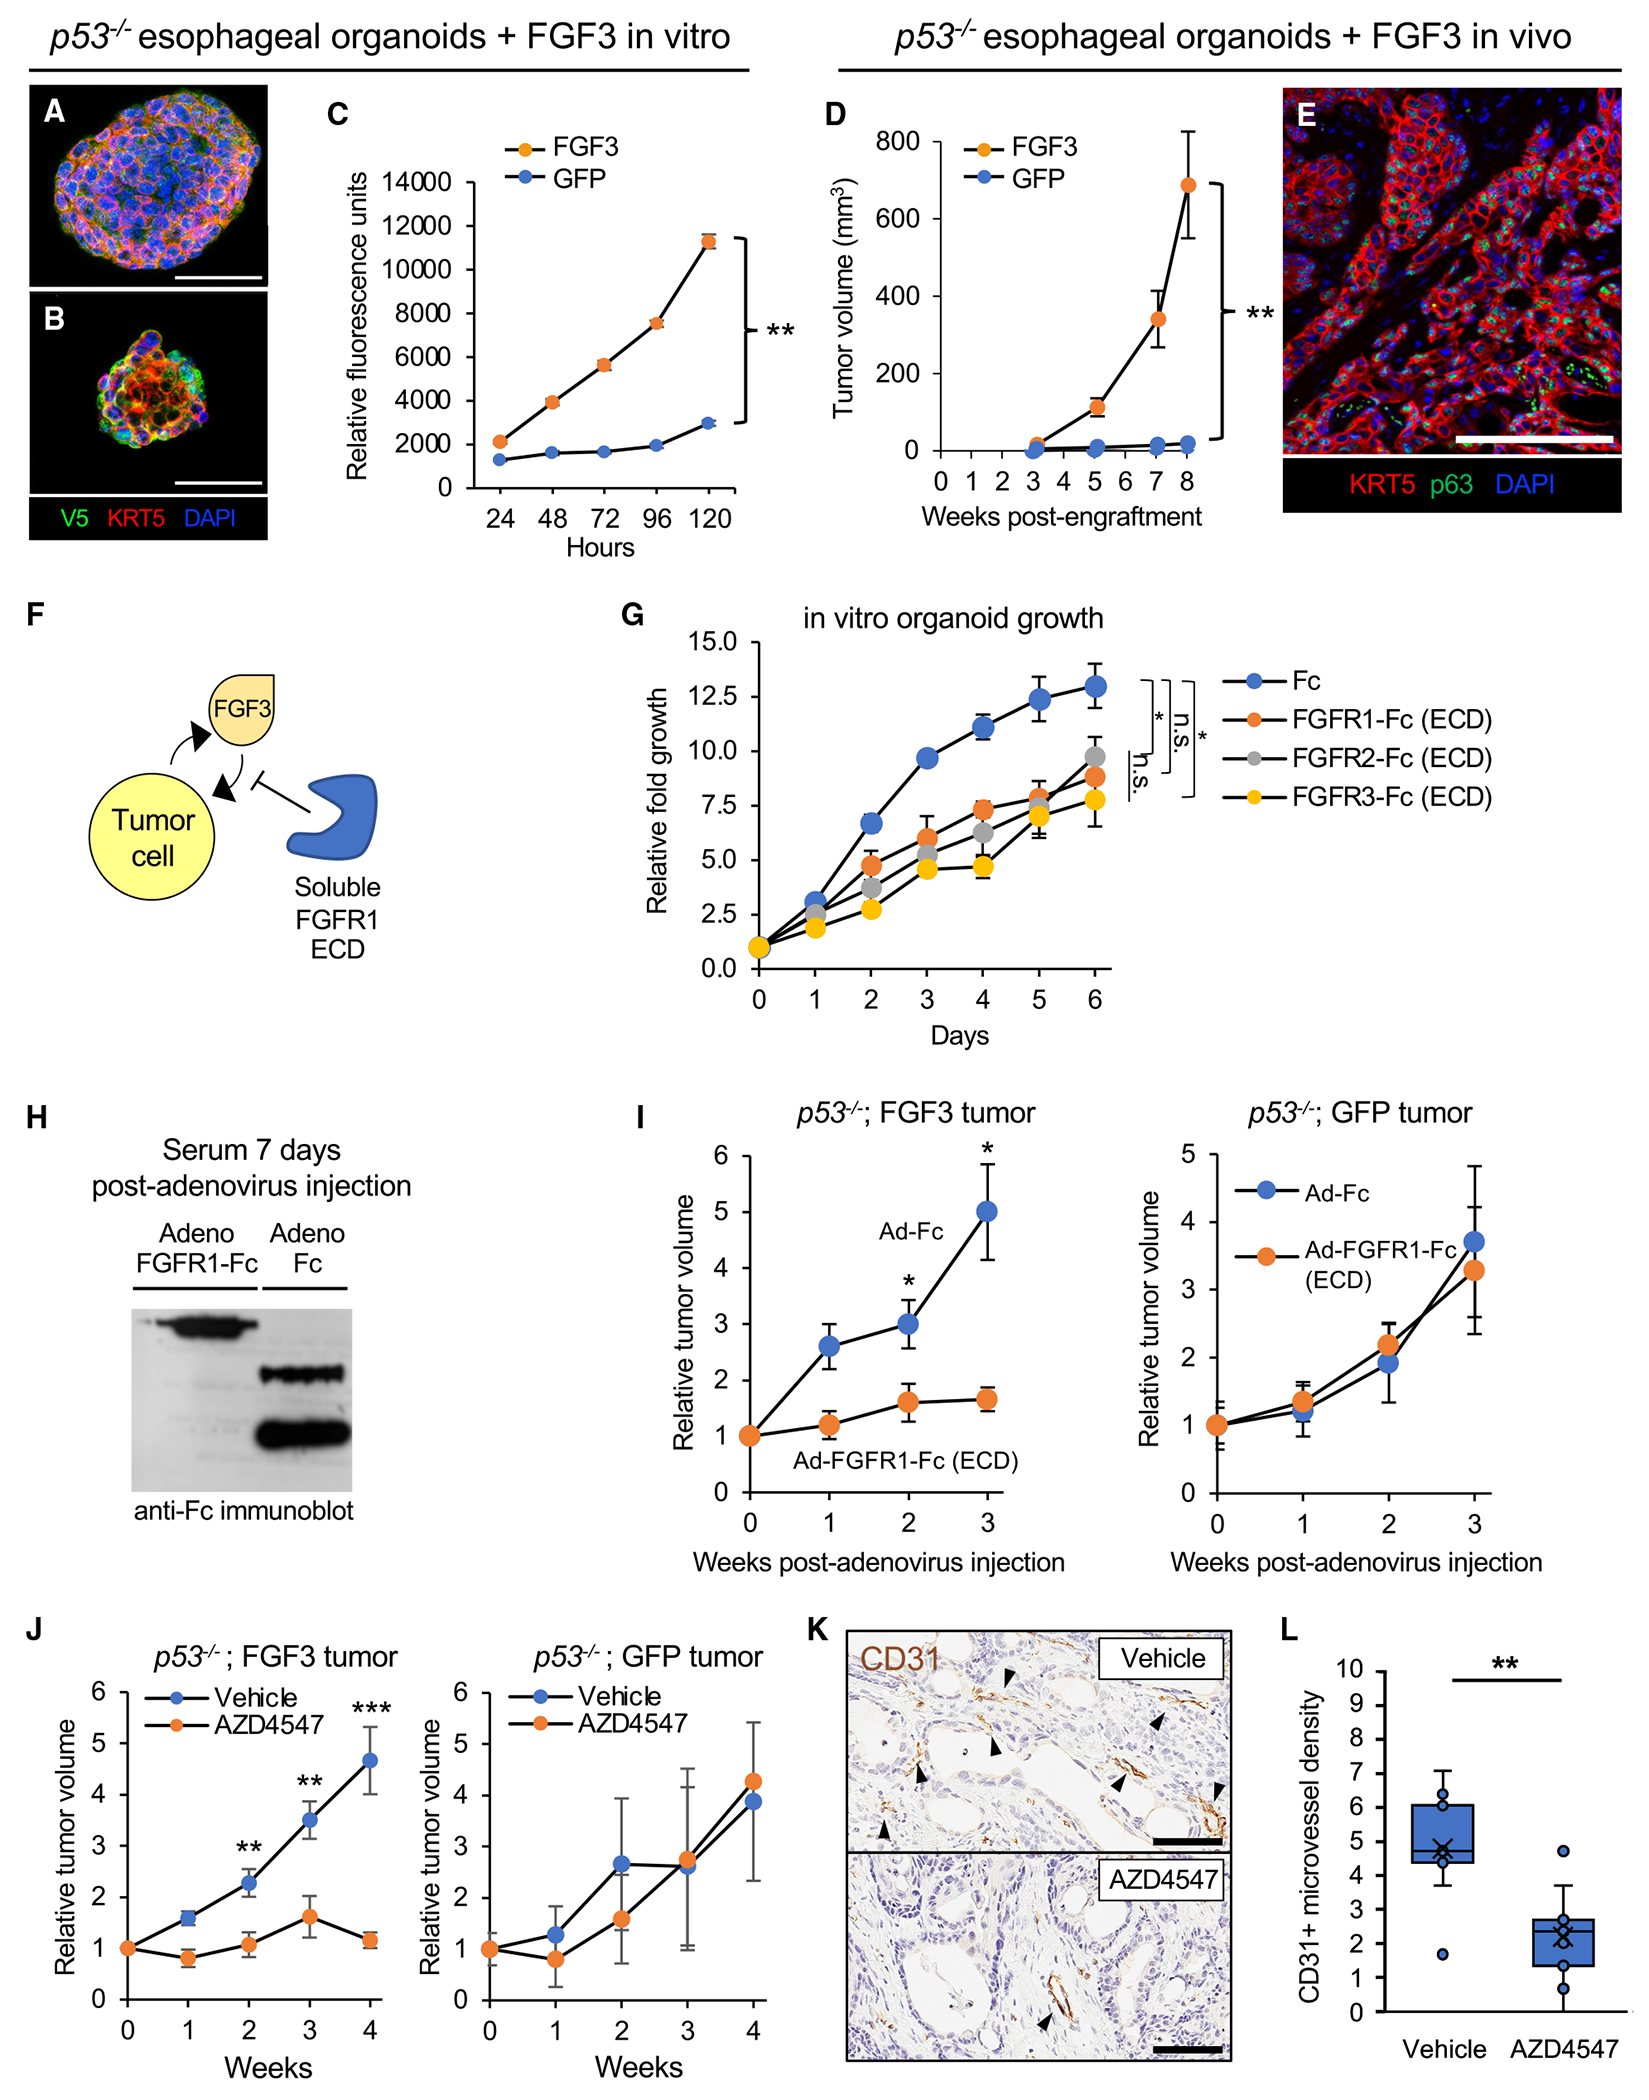
Figure 5. Targeting oncogenic FGF3 amplification with soluble FGFR-ECD or FGFR-specific tyrosine kinase inhibitors in p53−/− mouse esophageal squamous organoids.

(A) Multicolor immunofluorescence of p53−/− esophageal organoids with lentiviral expression of FGF3 with a C-terminal V5 tag. Scale bar: 100 μm.
(B) Multicolor immunofluorescence of p53−/− esophageal organoids with lentiviral expression of GFP with a C-terminal V5 tag. Scale bar: 100 μm.
(C) In vitro proliferation of FGF3 versus GFP-expressing p53−/− esophageal organoids by resazurin reduction. Data represent mean ± SEM. **p < 0.01, two-tailed Student’s t test.
(D) In vivo tumor formation and growth upon subcutaneous transplantation of FGF3- versus GFP-expressing p53−/− esophageal organoids in immunodeficient NOG mice. Each group has n = 10 biological replicate mice. Data represent mean ± SEM. *p < 0.05, **p < 0.01, two-tailed Student’s t test.
(E) Multicolor immunofluorescence of p53−/−;FGF3 esophageal organoid subcutaneous tumor sections. Scale bar: 100 μm.
(F) Schematic of inhibition of FGF3-driven oncogenesis by soluble ligand-binding extracellular domains of FGF receptors.
(G) Proliferation of FGF3 p53−/− esophageal organoids upon incubation with Fc or FGFR 1, 2, or 3 ECD-Fc fusions at 10 μg/mL assessed by resazurin reduction. Data represent mean ± SEM. *p < 0.05, two-tailed Student’s t test.
(H) Circulating serum expression of FGFR1-Fc fusion protein after intravenous injection of immunodeficient NSG mice infected with the corresponding recombinant adenoviruses. Western blot, anti-Fc.
(I) Serial measurements of subcutaneous tumor growth subsequent to adenoviral infection of FGFR1 ECD-Fc versus Fc controls in FGF3-expressing (n = 6) (left panel) or GFP-expressing (n = 5) (right panel) p53−/− esophageal organoid subcutaneous tumors. Data represent mean ± SEM. *p < 0.05, two-tailed Student’s t test.
(J) Serial measurements of FGF3-expressing (left panel) or GFP-expressing (right panel) p53−/− esophageal organoid subcutaneous tumors subsequent to daily oral administration of vehicle or the FGFR inhibitor AZD4547. FGF3-expressing organoids have n = 9 biological replicate mice in each treatment group. GFP-expressing organoids have n = 8 in the vehicle treatment group and n = 7 in the AZD4547 treatment group. **p < 0.01, ***p < 0.001, two-tailed Student’s t test.
(K) Representative CD31 immunohistochemistry staining of subcutaneous tumors from FGF3-expressing p53−/− esophageal organoids in (E). Scale bar: 200 μm.
(L) Chalkley quantitation of CD31+ microvessel density in (F), where each group is three technical replicates for each mouse subcutaneous tumor. **p < 0.01, two-tailed Student’s t test.
