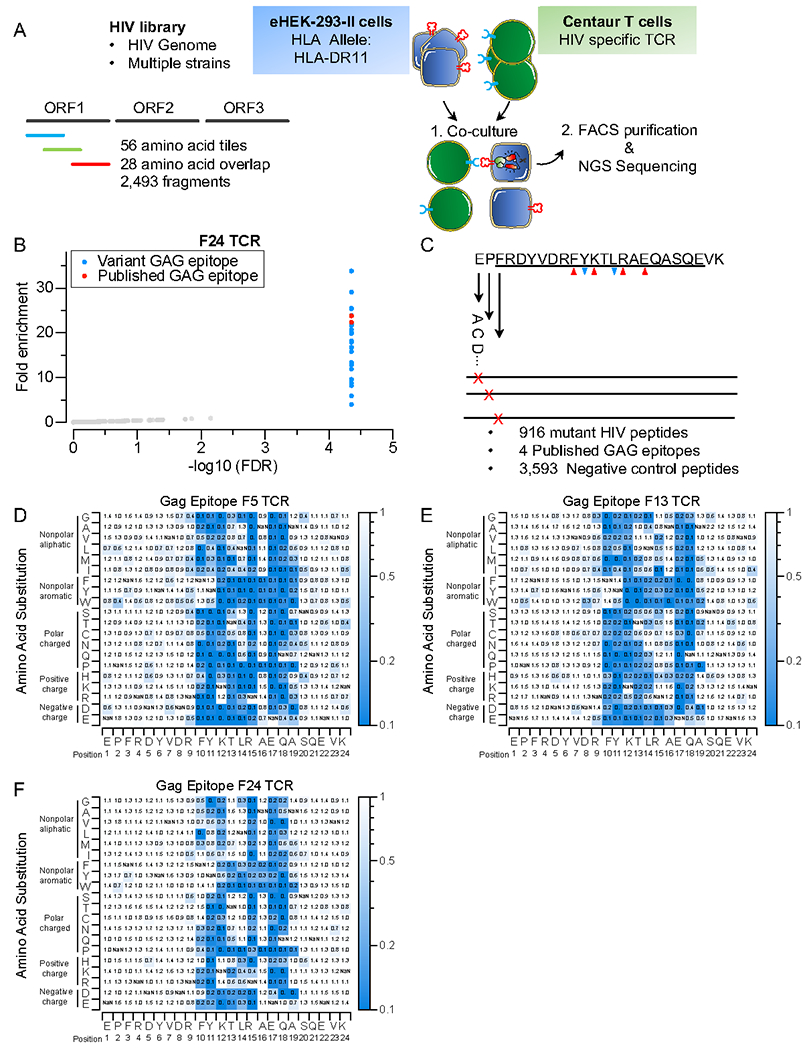
Figure 2. HIV genome-wide and Mutagenesis TScan-II screens.

A) Schematic of TScan-II HIV genome-wide screen. The HIV library comprises 2,492 peptide fragments tiling across the genomes of multiple HIV strains in 56aa steps with 28aa overlap.
B) TScan-II screen using an HIV elite controller TCR against the HIV library. Each dot represents one peptide. The y-axis shows the geometric mean of the fold-change across seven replicates for screens with HLA-DRB1*1101 and the GAG-specific TCR (F24). Red dots represent peptides, with an epitope identical to the published Gag epitope for this TCR, blue dots represent variant Gag epitopes.
C) The GAGepitope saturation mutagenesis library. The library encodes 4 WT epitopes, 956 mutant Gag epitopes, and 3,593 negative controls. The downward blue arrows indicate anchor residues, while the upward red arrows indicate TCR-facing residues.
D, E, and F) Heatmap representation of comprehensive mutagenesis analysis of GAG epitope using 3 HIV elite controller TCRs, F5 (D), F13 (E), and F24(F). The heatmap value represents this mutant’s relative enrichment compared to the published (Gag) epitope.
