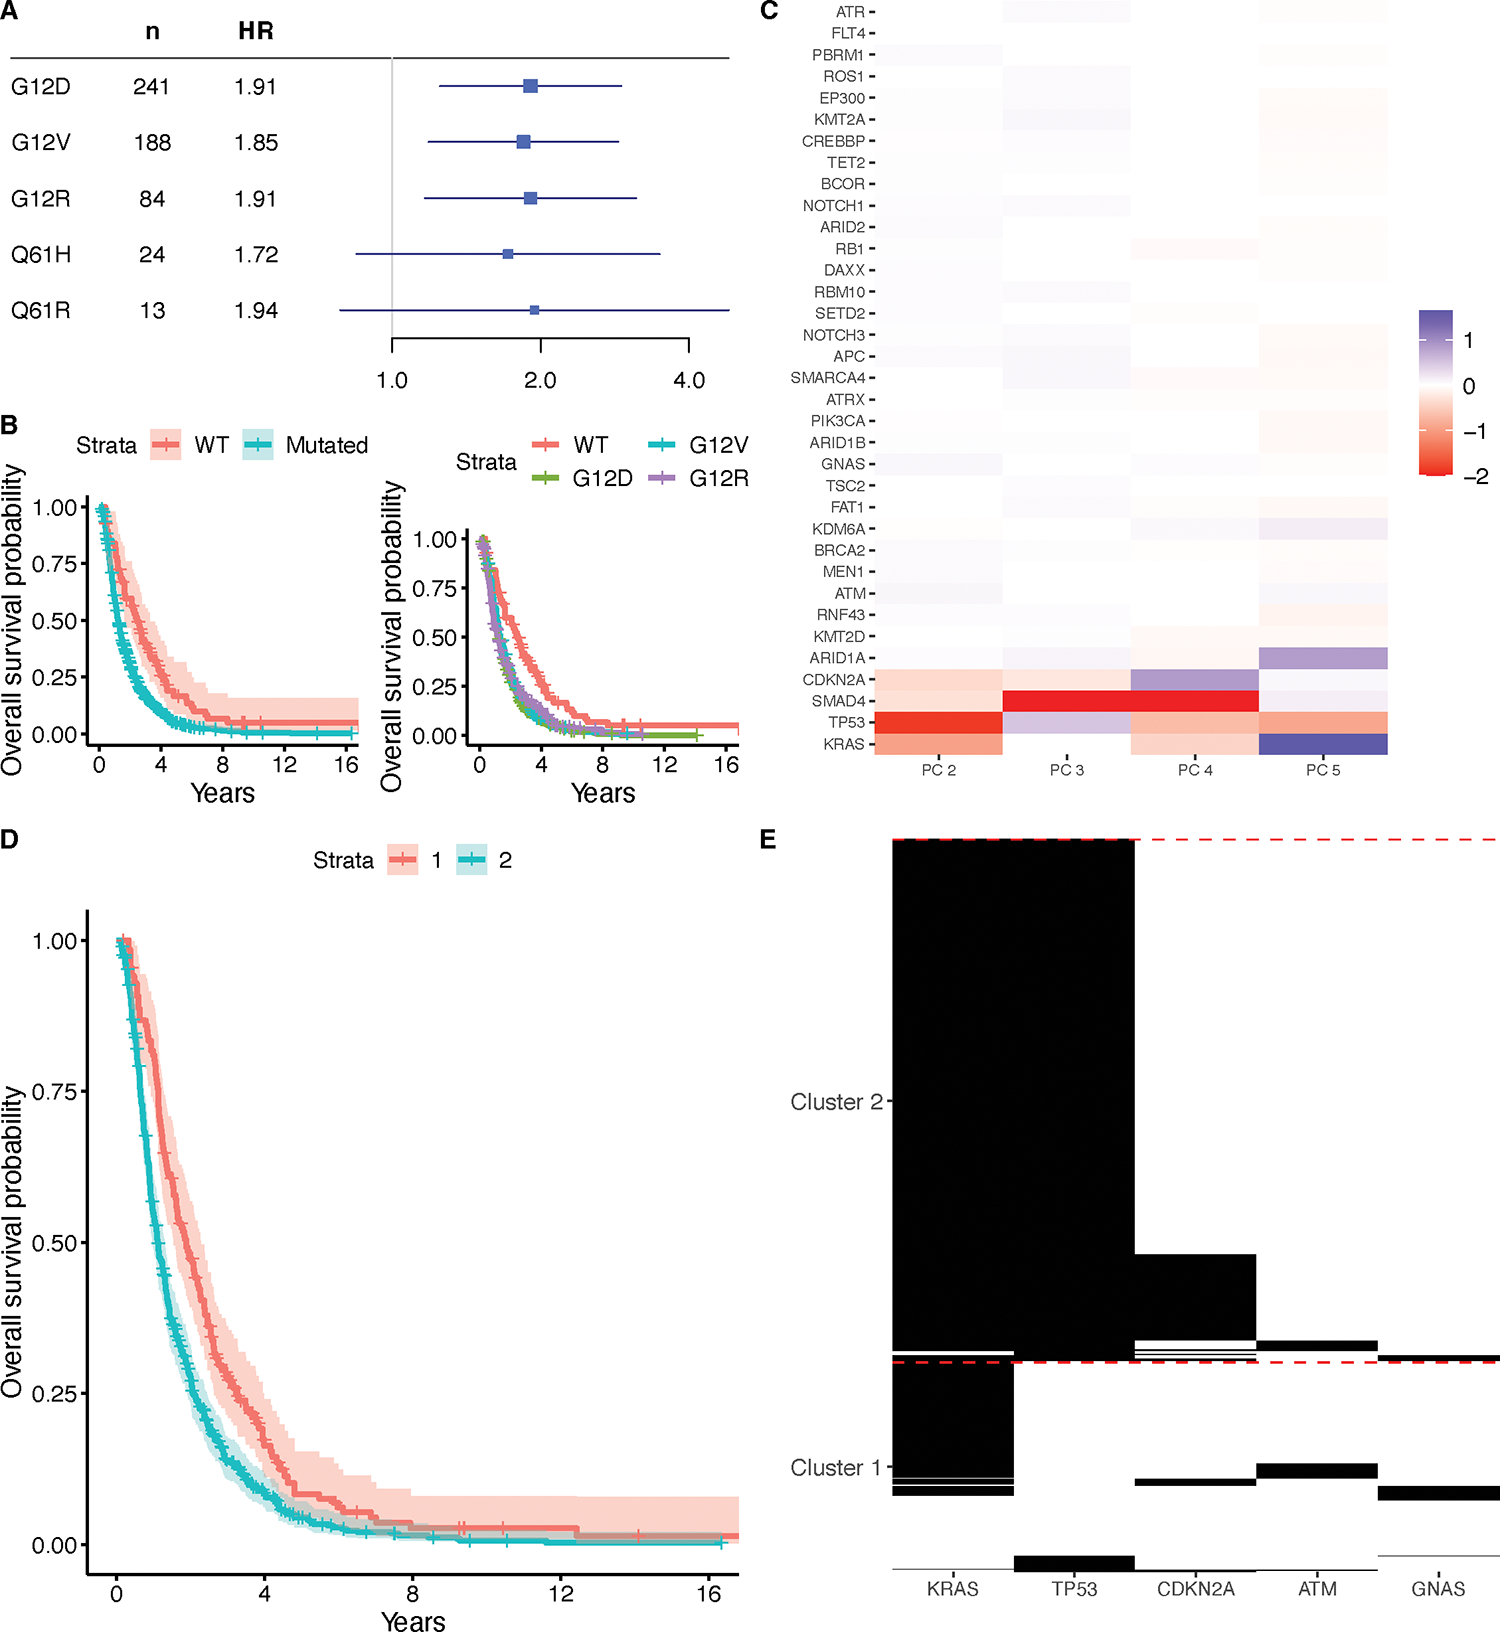
Figure 3.

Associations of KRAS mutations with survival in the PDAC cohort. (A) HRs with corresponding 95% Bonferroni CIs for each specific KRAS mutation type occurring in at least 10 patients, as assessed via Cox proportional hazards regression models adjusting for age, sex, histology, and stage at diagnosis. (B) Kaplan-Meier curves with 95% confidence intervals for patients with wild-type KRAS and patients with any kind of KRAS mutation, and Kaplan-Meier curves for patients with wild-type KRAS, and patients with G12V, Q61H, G12D, or G12R mutations. (C) Loadings matrix for the second through fifth principal component found from applying B-PCA to mutation data in the PDAC cohort. Negative loadings are capped at −2 for visualization purposes. (D) Kaplan-Meier curves comparing the patients in two clusters, derived from clustering the patient scores for the principal components. (E) Heatmap showing mutation patterns among the genes with top loadings in each of the two clusters.
