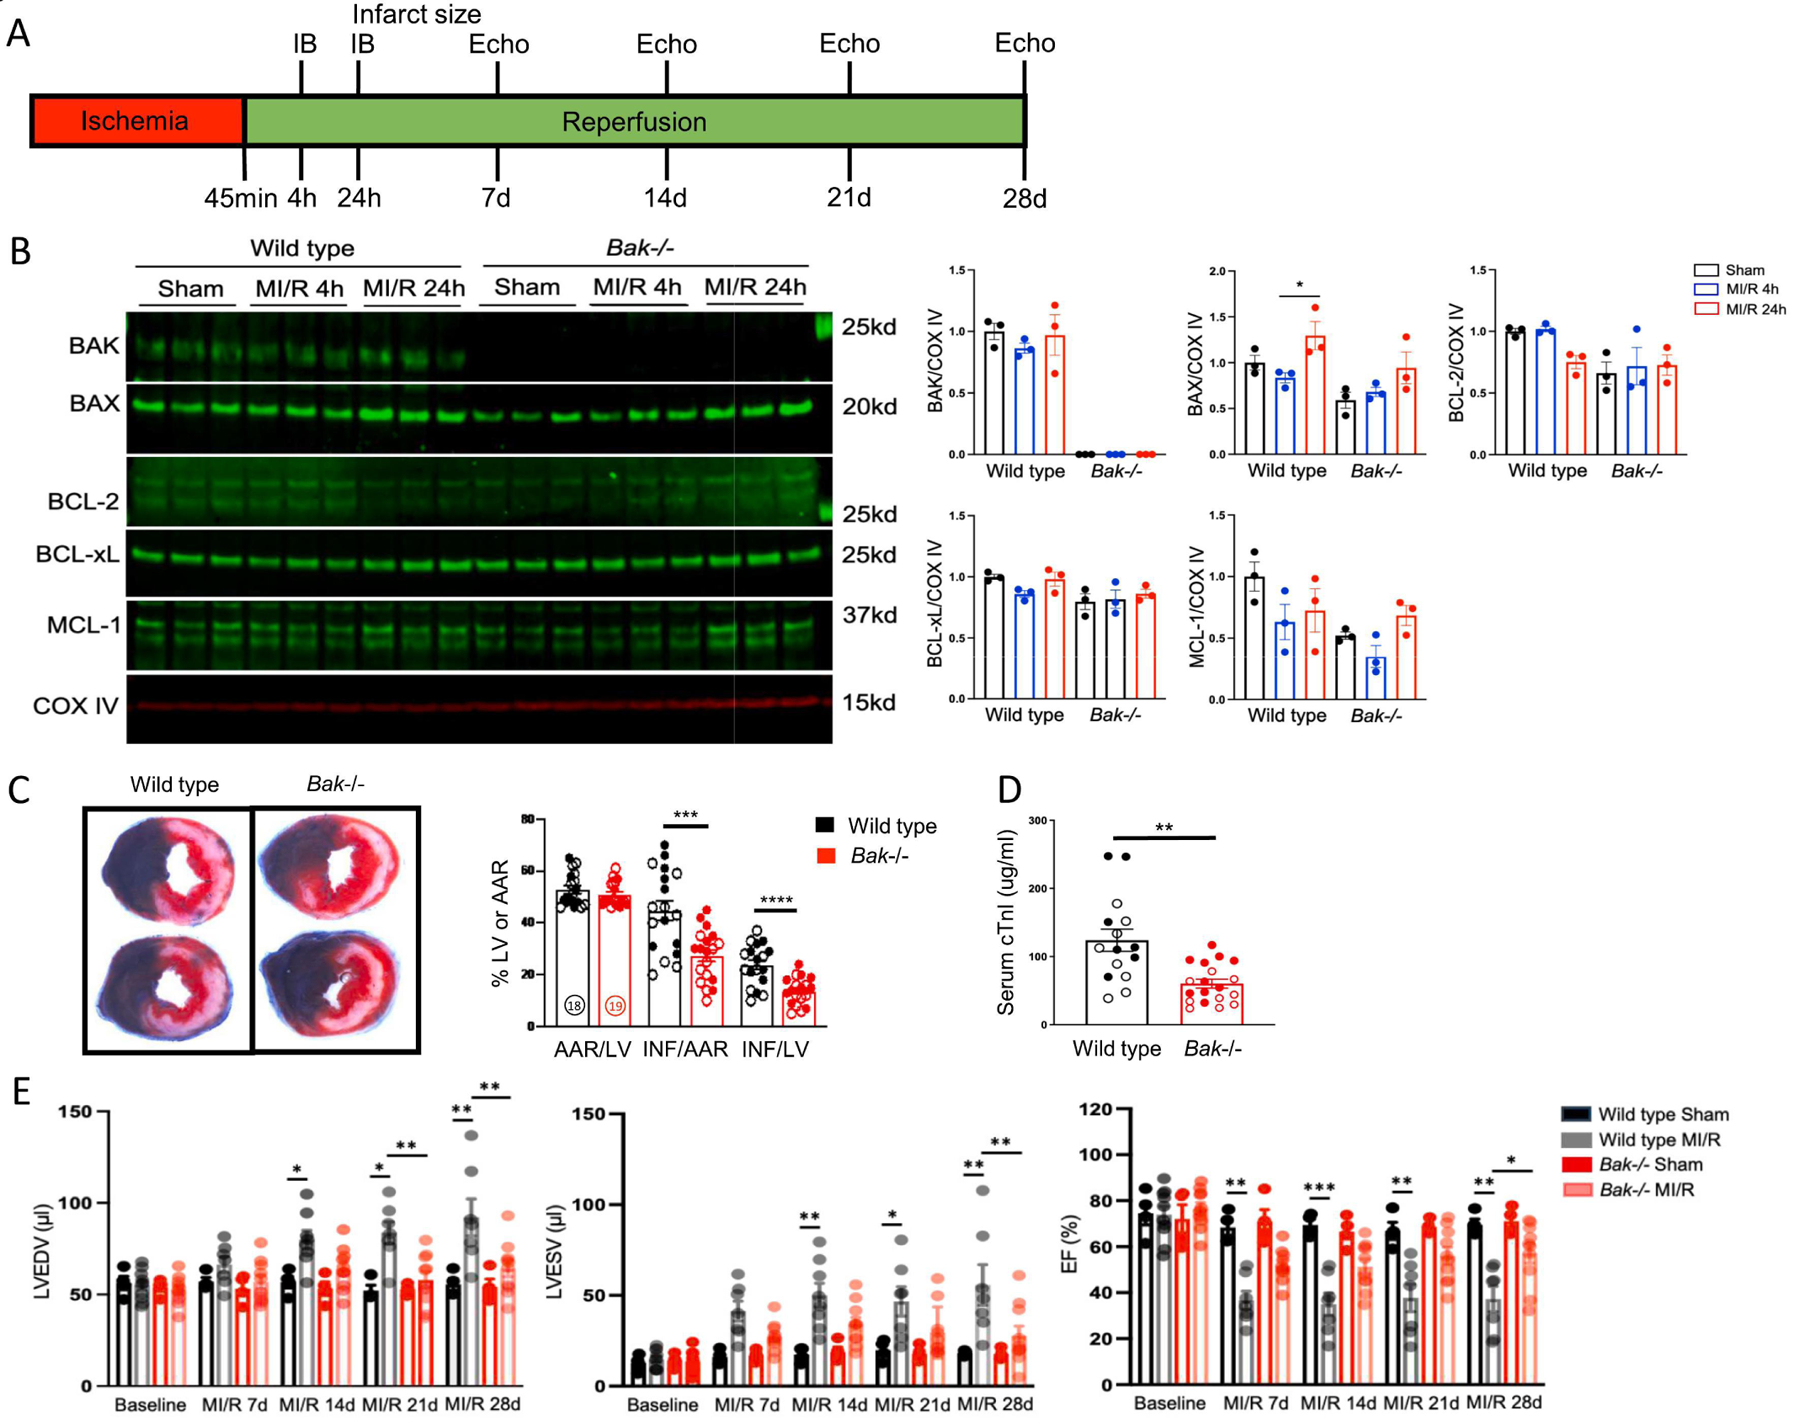
Fig. 1. Effect of Bak deletion on infarct size in MI/R.

A. Schematic depicting MI/R protocol. B. Western blot analysis and quantification of the indicated proteins in cardiac mitochondria isolated from the left ventricular free wall of wild type and Bak−/− mice subjected to sham operation (harvested 24 h later) (black) or 45 min ischemia followed by 4 h (blue) or 24 h (red) reperfusion (N=3 male mice/group). C. Representative images and quantification of Evans blue dye and tetrazolium chloride-stained hearts from wild type (black; N=18 (9 male and 9 female)) and Bak−/− (red; N=19 (10 male and 9 female)) mice subjected to 45 min ischemia/24 h reperfusion. AAR/LV – area at risk/left ventricle. INF/LV – infarct size/ left ventricle. INF/AAR – infarct/area at risk. Males and females demarcated by filled and open circles, respectively. D. Serum concentrations of cardiac troponin I (cTnI) in wild type (black; N=15 (7 male and 8 female) and Bak−/− (red; N=18 (9 male and 9 female) mice subjected to 45 min ischemia/24 h reperfusion. E. Echocardiographically-determined left ventricular end-diastolic volume (LVEDV), left ventricular end-systolic volume (LVESV), and ejection fraction (EF) in wild type and Bak−/− mice at baseline and following sham operation or MI/R at the indicated time points (N=4 sham for each genotype, 7 wild type MI/R, 10 Bak−/− MI/R male mice). Wall thicknesses are shown in Fig. S2. Data – mean ± SEM. Statistic: Student’s t-test comparing 2 groups; ANOVA with Tukey’s post-test for ≥ 3 groups. * P < 0.05, ** P < 0.01, *** P < 0.001, **** P < 0.0001.
