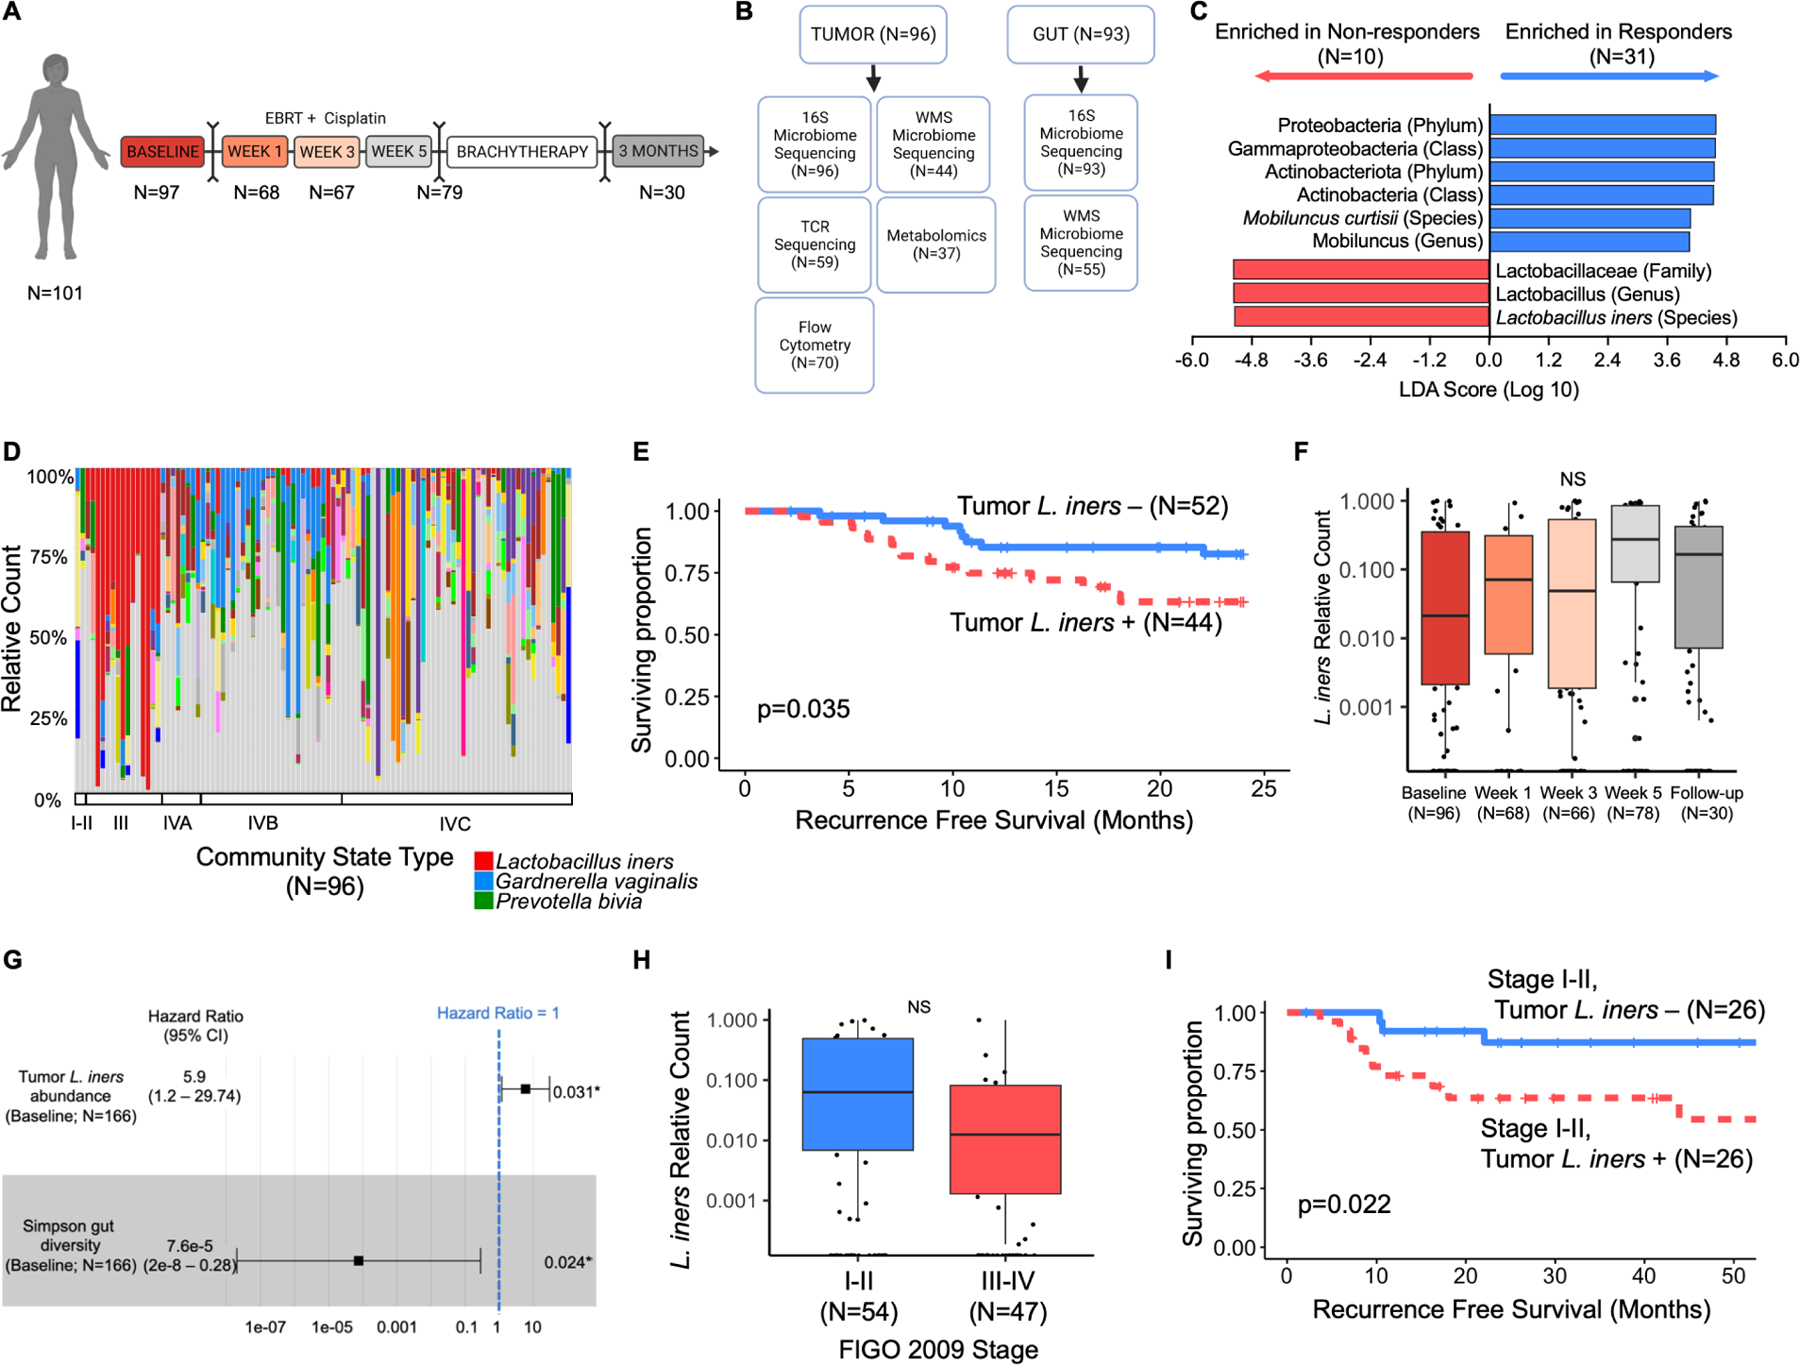
Figure 1. Tumor-resident Lactobacillus iners is associated with decreased recurrence-free and overall survival in cervical cancer patients.

A. Study design and standard of care treatment algorithm for patients on study with number of cervical tumor swabs collected at each timepoint for 16S ribosomal RNA sequencing (16S). Patients received 5 weeks of EBRT with concurrent cisplatin followed by brachytherapy and repeat imaging for disease response at 3 months. Sampling was at baseline, Weeks 1, 3 and 5 of radiation, and at 3 month follow up.
B. Sample types collected and available for each analysis at baseline (pre-treatment). Tumor and gut samples were collected where possible from each patient at each timepoint; however, not all samples were collected or available for sequencing at each timepoint.
C. Linear discriminant analysis effect size (LEfSe) analysis of 16S data from cervical tumor swabs for bacteria enriched in non-responders to radiation in a pilot cohort (N=41). Default parameters were used for LEfSe analysis with an LDA threshold of 4.0 for statistical significance and visualization.
D. 16S compositional stacked bar plots of cervical tumor swabs for all patients at baseline (N=97), sorted by vaginal community state type (CST), including L. iners (red), G. vaginalis (blue), and P. bivia (green).
E. Kaplan-Meier recurrence-free survival (RFS) curves stratified by presence (N=44) or absence (n=52) of tumoral L. iners. Survival curves censored at 24 months. Log-rank test for comparison. Total # of events = 33.
F. 16S relative counts of L. iners in cervical tumor swabs collected during CRT. Week 1 (N=68), week 3 (N=66), week 5 (N=78), and follow-up (N=30) compared to baseline (N=96) using paired t-tests and false discovery rate (FDR) adjusted p-value. Box represents interquartile range (25th to 75th), bar indicates median, whiskers represent minimum and maximum values.
G. Multivariate cox proportional hazard analysis for overall survival (OS), adjusting for gut microbiome diversity (N=90) and tumoral L. iners (N=90). Total # of events = 14. Square represents hazard ratio (HR), bars represent 95% confidence intervals on HR.
H. Baseline relative counts of L. iners stratified by tumor size (FIGO 2009 Stage I-II [N=54] vs Stage III-IV [N=47]). Unpaired t-test. NS=p>0.05. Box represents interquartile range (25th to 75th), bar indicates median, whiskers represent minimum and maximum values.
I. Kaplan-Meier RFS curves for patients with FIGO 2009 Stage I-II tumors, stratified by presence (N=26) or absence (n=26) of tumoral L. iners. Survival curves censored at 54 months. Log-rank test for comparison.
