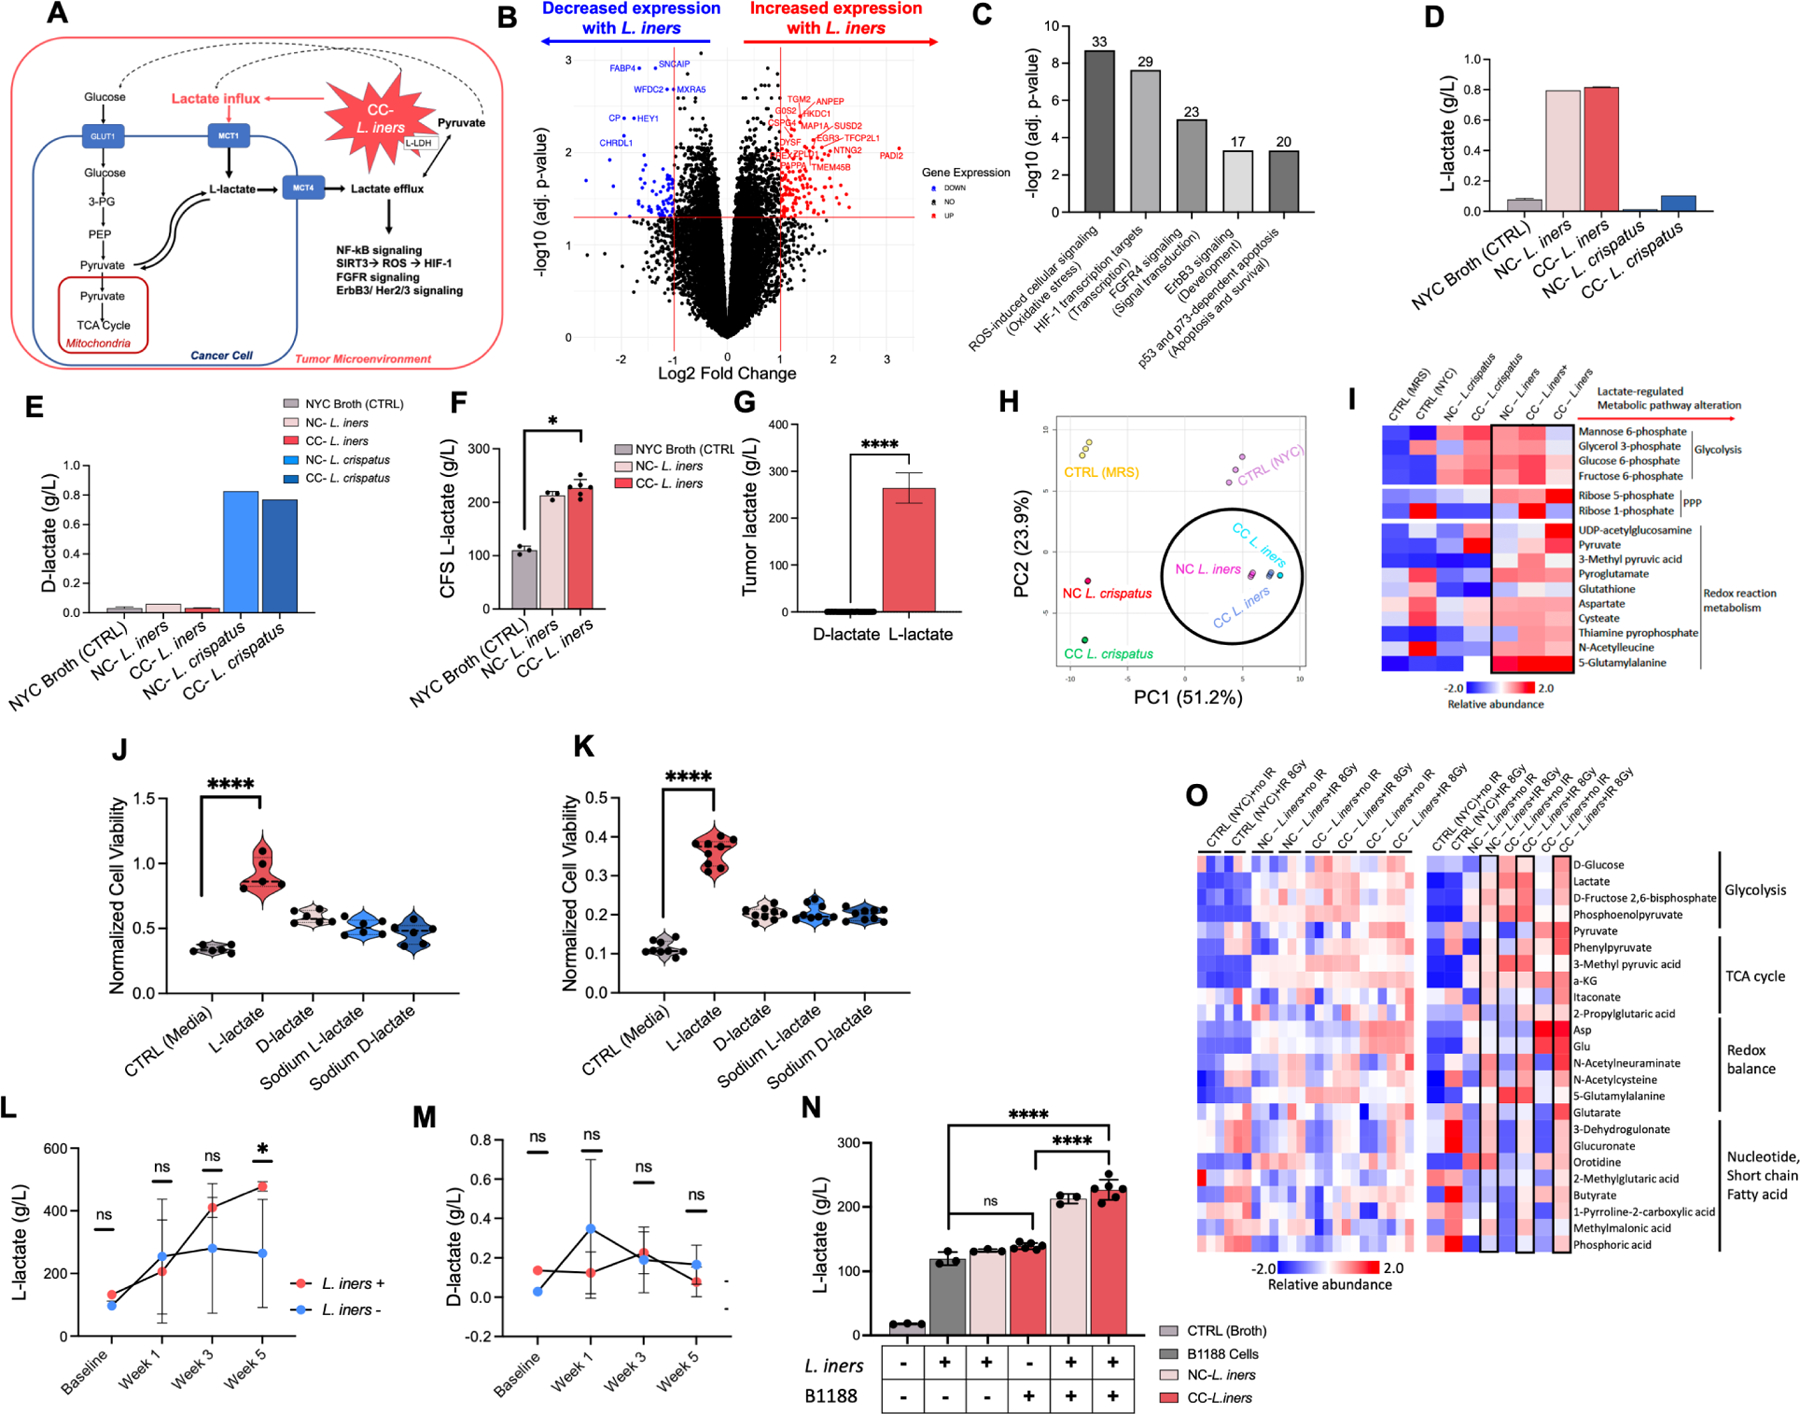
Figure 3. L. iners causes treatment resistance through increased L-lactate production in the tumor microenvironment.

A. Hypothetical schematic of L. iners production of L-lactate in the tumor microenvironment “priming” cervical cancer cells for lactate addiction, driving the feedback loop of lactate utilization via upregulation of GLUT1, MCT1 and MCT4, and lactate-regulated induction of reactive oxygen species signaling, HIF-1, NFkB, FGFR, ErbB3/HER 2/3, and p53 dependent pathways.
B. B1188 cells pre-treated with L. iners (1 NC-L. iners strain, 2 CC-L. iners strains) vs. control (NYC broth) CFS prior to RNA sequencing. Fold change in gene expression from control (right) to L. iners (left) is shown. Log2 (Fold Change) threshold of −1, 1. –Log10 (FDR-adjusted p-value) threshold is 1.2.
C. Metacore pathway analysis of significantly altered genes. Top 5 most significantly altered pathways are shown ranked by -Log10 (FDR-adjusted p-value). Number above bar represents the proportion of genes altered in each pathway.
D. L-lactate production in bacterial culture of cancer-derived CC-L. crispatus, CC-L. iners, NC-L. crispatus, NC-L. iners, and control (NYC broth).
E. D-lactate production in bacterial culture of cancer-derived CC-L. crispatus, CC-L. iners, NC-L. crispatus, NC-L. iners, and control (NYC broth).
F. L-lactate levels in bacterial culture for control (NYC Broth), NC-L. iners or CC-L. iners.
G. L-lactate and D-lactate relative levels (g/L) for cervical tumor Cytobrush samples (log scale). N=29.
H. Principal component analysis (PCA) of metabolites.
I. Unsupervised hierarchical clustering of most differentially abundant metabolites, grouped by metabolic process.
J. Cell viability (CellTiter Glo) of pretreated B1188 cells with 20mM lactate isoforms (L-lactate, D-lactate, Sodium L-lactate, Sodium D-lactate, media control) after irradiation (4Gy).
K. Cell viability (CellTiter Glo) of pretreated B1188 cells with 20mM lactate isoforms after GEM.
L. L-lactate levels in cervical tumor Cytobrush samples before, during (Week 1, Week 3) and after EBRT (Week 5) for L. iners + patients (BL N=1; Wk1 N=6; Wk3 N=2; Wk5 N=4) and L. iners− patients (BL N=3; Wk1 N=4; Wk3 N=6; Wk 5 N=4).
M. D-lactate levels in cervical tumor Cytobrush samples.
N. L-lactate levels for media control (−/−), L. iners in culture alone (+/−), B1188 cells in culture alone(−/+), vs. B1188 cells treated with L. iners CFS (+/+) for NC-L. iners and CC-L. iners.
O. Differentially abundant metabolites present in primary cells B1188 treated with NYC Broth (control), NC-L. iners (N=1) CFS, and CC-L. iners (N=2) CFS, either nonirradiated (0Gy) or irradiated (8Gy), grouped by metabolic process.
Unsupervised hierarchical clustering of most differentially abundant metabolites, grouped by metabolic process (I,O); Analyzed by Megazyme Kit (D,E), TC-MS (L-N) or HR-MS/IC-MS (I,O); Wilcoxon rank-sum test (J-M), unpaired t-test with mean and SEM (G) or 2-way ANOVA (F) with NS P > 0.05, *P ≤ 0.05, ** P ≤ 0.01, *** P ≤ 0.001, **** P ≤ 0.0001; 1 (B,F,J),N, 2 (H-J) or 3 (K) experiments, 3 replicates each, 2 CC-L. iners strains pooled (B,F,J); 1 experiment, 1 culture plate, no statistical comparisons (D-E). Wilcoxon rank-sum test vs. CTRL unadjusted (J-L) and adjusted (N); Comparisons for cells treated with MRS Broth (L. crispatus control), NYC Broth (L. iners control), and cancer and non-cancer derived L. iners (N=3) and L. crispatus strains (N=2) (H-I). Normalized to unirradiated media control (J-K).
