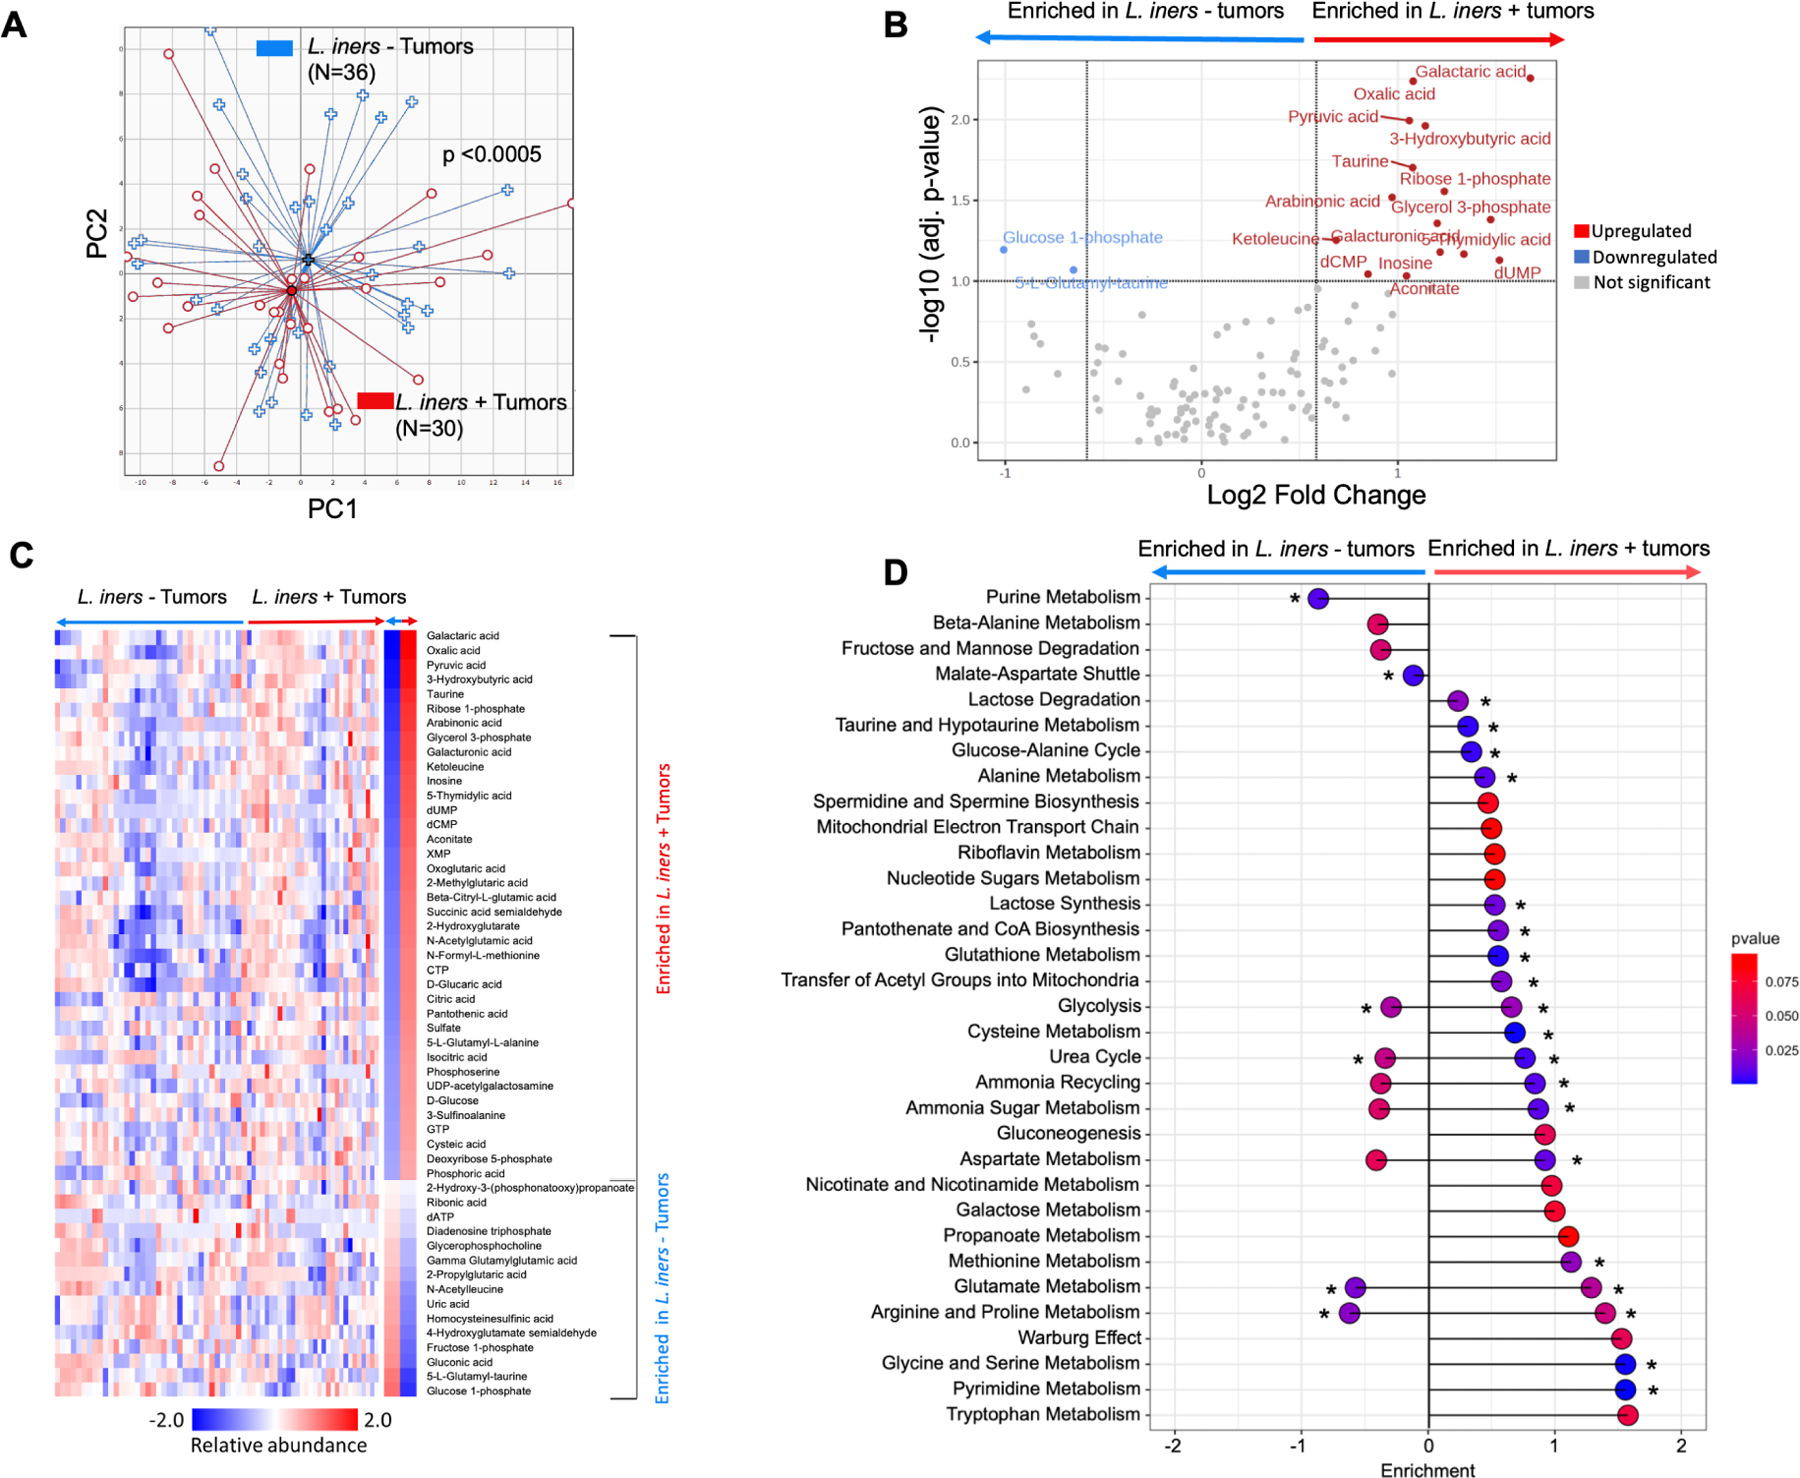
Figure 4. L. iners positive tumors have metabolic alterations compared to L. iners negative tumors.

A. Principal coordinate analysis of relative abundances of tumor metabolites for L. iners+ (N=36) and L. iners− tumors (N=30). Dispersion Separability Criterion, p<0.005.
B. Volcano plot of differentially abundant metabolites. –Log10 (adj. p-value) threshold=1.0; log2 (Fold Change) threshold −1 to 1.
C. Supervised hierarchical clustering of differentially abundant metabolites.
D. Lollipop plot of pathway assignments for differentially enriched metabolites. Sorted by effect size on a log10 scale. * FDR-adj p<0.05.
Analyzed by HR-MS and IC-MS (A-D).
