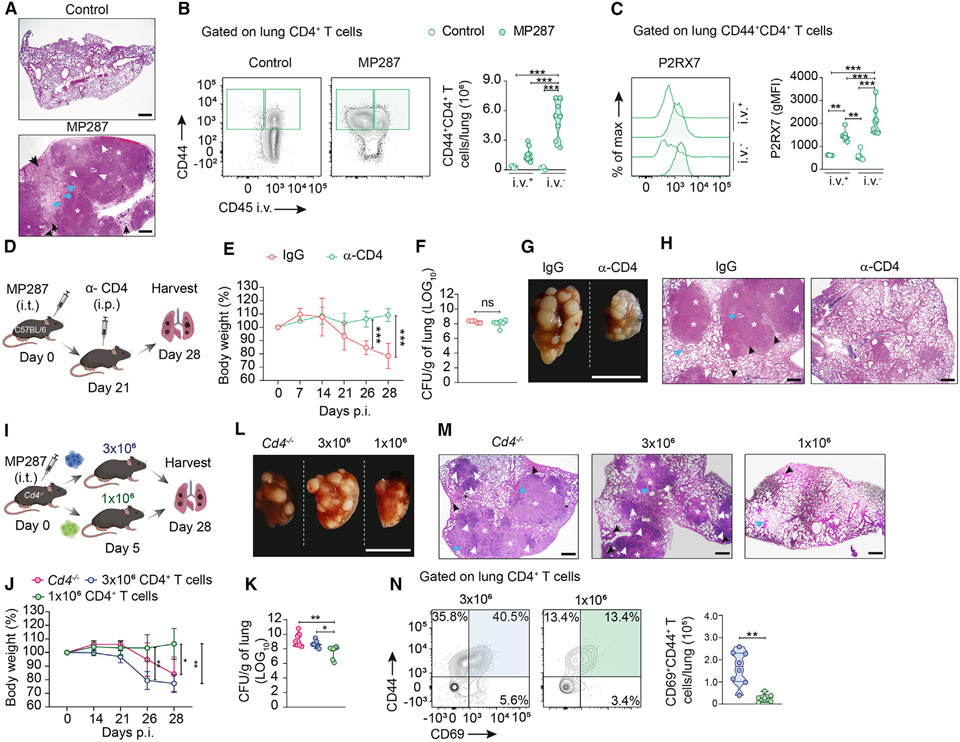
Figure 1. Excessive accumulation of parenchymal CD4+ T cells induces lung severe disease in response to hypervirulent mycobacteria.
C57BL/6 (WT) or CD4-KO mice (Cd4−/−) were infected with ~100 CFU of Mbv MP287 strain. Non-infected mice were used as controls.
(A) Representative lung sections of WT mice stained with hematoxylin and eosin (H&E). White asterisks indicate necrotic areas, white arrows indicate alveolitis, blue arrows indicate bronchial obstruction, and black arrows indicate perifocal exudative reaction. Scale bars, 500 μm.
(B) Left: flow-cytometry plots of CD44 and CD45i.v. in WT CD4+ T cells. Right: average numbers of CD45i.v.+ and CD45i.v.− CD44+CD4+ T cells/lung.
(C) Left: histograms of P2RX7 expression in CD45i.v.+ and CD45i.v.− WT CD44+CD4+ T cells. Right: average geometric mean fluorescence intensity (gMFI) of P2RX7.
(D) CD4+ T cell depletion protocol (BioRender.com). Infected WT mice were treated with control immunoglobulin G or α-CD4 antibody.
(E) Average body weights (percentages related to day 0) of mice from (D).
(F) Lung CFU numbers of mice from (D).
(G) Macroscopic images of right upper lung lobes of mice from (D). Scale bar, 1 cm.
(H) Representative H&E lung sections of mice from (D). Scale bars, 500 μm.
(I) Adoptive transfer protocol (BioRender.com). Infected CD4-KO mice were transferred with 1 × 10⁶ or 3 × 10⁶ WT CD4+ T cells.
(J) Average body weights (percentages related to day 0) of mice from (I).
(K) Lung CFU numbers of mice from (I).
(L) Macroscopic images of right upper lung lobes of mice from (I). Scale bar, 1 cm.
(M) Representative lung sections stained with H&E of mice from (I). Scale bars, 500 μm.
(N) Left: flow-cytometry plots of CD44 and CD69 in CD4+ T cells of mice from (I). Right: average numbers of CD45i.v.+ and CD45i.v.− CD44+CD4+ T cells/lung.
Data from three independent experiments, n = 3–5/experimental group per experiment. Data shown as means ± SD. *p < 0.05, **p < 0.01, ***p < 0.001, one-way ANOVA (Tukey post tests) (B, C, J, and K) or unpaired t tests (E, F, and N).

