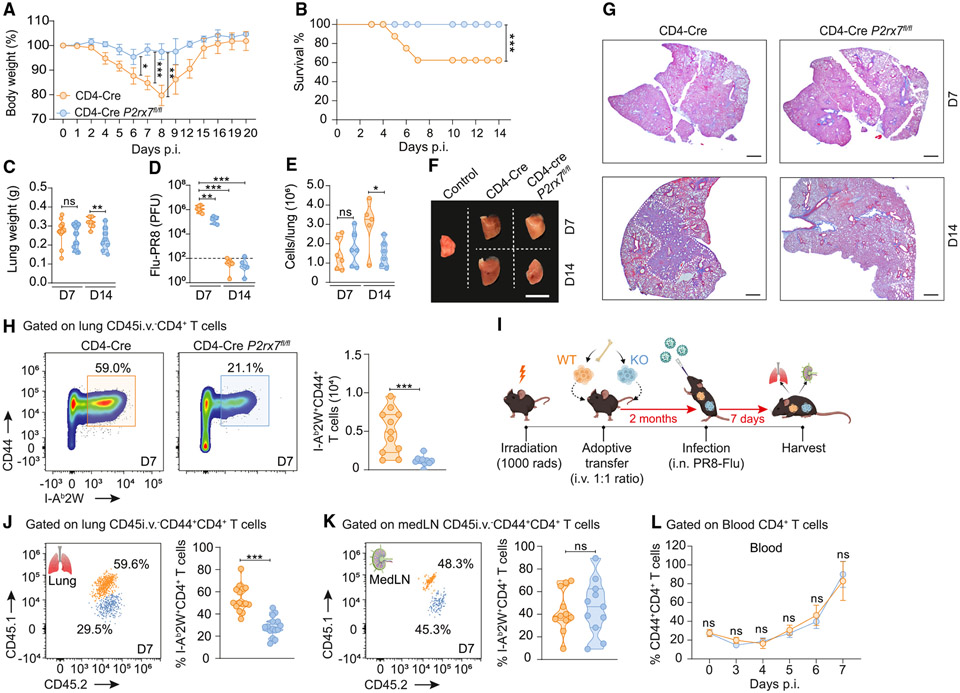
Figure 5. T cell-intrinsic P2RX7 promotes the accumulation of lung parenchymal CD4+ T cells and lung inflammation in response to influenza virus.
WT (CD4-Cre) and T cell-P2RX7-KO (CD4-Cre P2rx7fl/fl) mice were infected with influenza virus (PR8-2W, LD50 ~ 1,400 plaque-forming units).
(A) Average body weights (related to day 0).
(B) Survival curves over time.
(C) Average lung weights.
(D) Average viral loads.
(E) Average lung cell numbers.
(F) Macroscopic images of right upper lung lobes. Scale bar, 1 cm.
(G) Representative lung sections stained with Masson’s trichrome. Scale bars, 20 μm.
(H) Left: flow-cytometry plots of CD44 and CD45i.v. on I-Ab2W+CD4+ T cells. Right: average numbers of CD45i.v.+ and CD45i.v.− I-Ab2W+CD44+CD4+ T cells.
(I–L) In some experiments, WT (CD45.1+) mice were lethally irradiated and reconstituted with a 1:1 mix of WT (CD45.1/2+) and T cell-P2RX7-KO (CD45.2+) bone marrow cells. After 2 months, mice were infected with PR8-2W.
(I) Experimental protocol (BioRender.com).
(J) Left: flow-cytometry plots of CD45.1 and CD45.2 on lung CD45i.v.− I-Ab2W+CD4+CD44+ T cells. Right: average frequencies of CD45.1+ and lung CD45.2+ I-Ab2W+CD4+CD44+ T cells. (K) Left: flow-cytometry plots of CD45.1 and CD45.2 on medLN I-Ab2W+CD4+CD44+ T cells. Right: average frequencies of medLN CD45.1+ and CD45.2+ I-Ab2W+CD4+CD44+ T cells. (L) Average frequency of CD44+CD4+ T cells in the blood over acute infection.
Data from three independent experiments, n = 3–5/experimental group per experiment. Data shown as means ± SD. *p < 0.05, **p < 0.01, ***p < 0.001, one-way ANOVA (Tukey post tests) (C–E), log-rank survival analysis (B), or unpaired t tests (A, H, and J–L).

