
Figure 1:
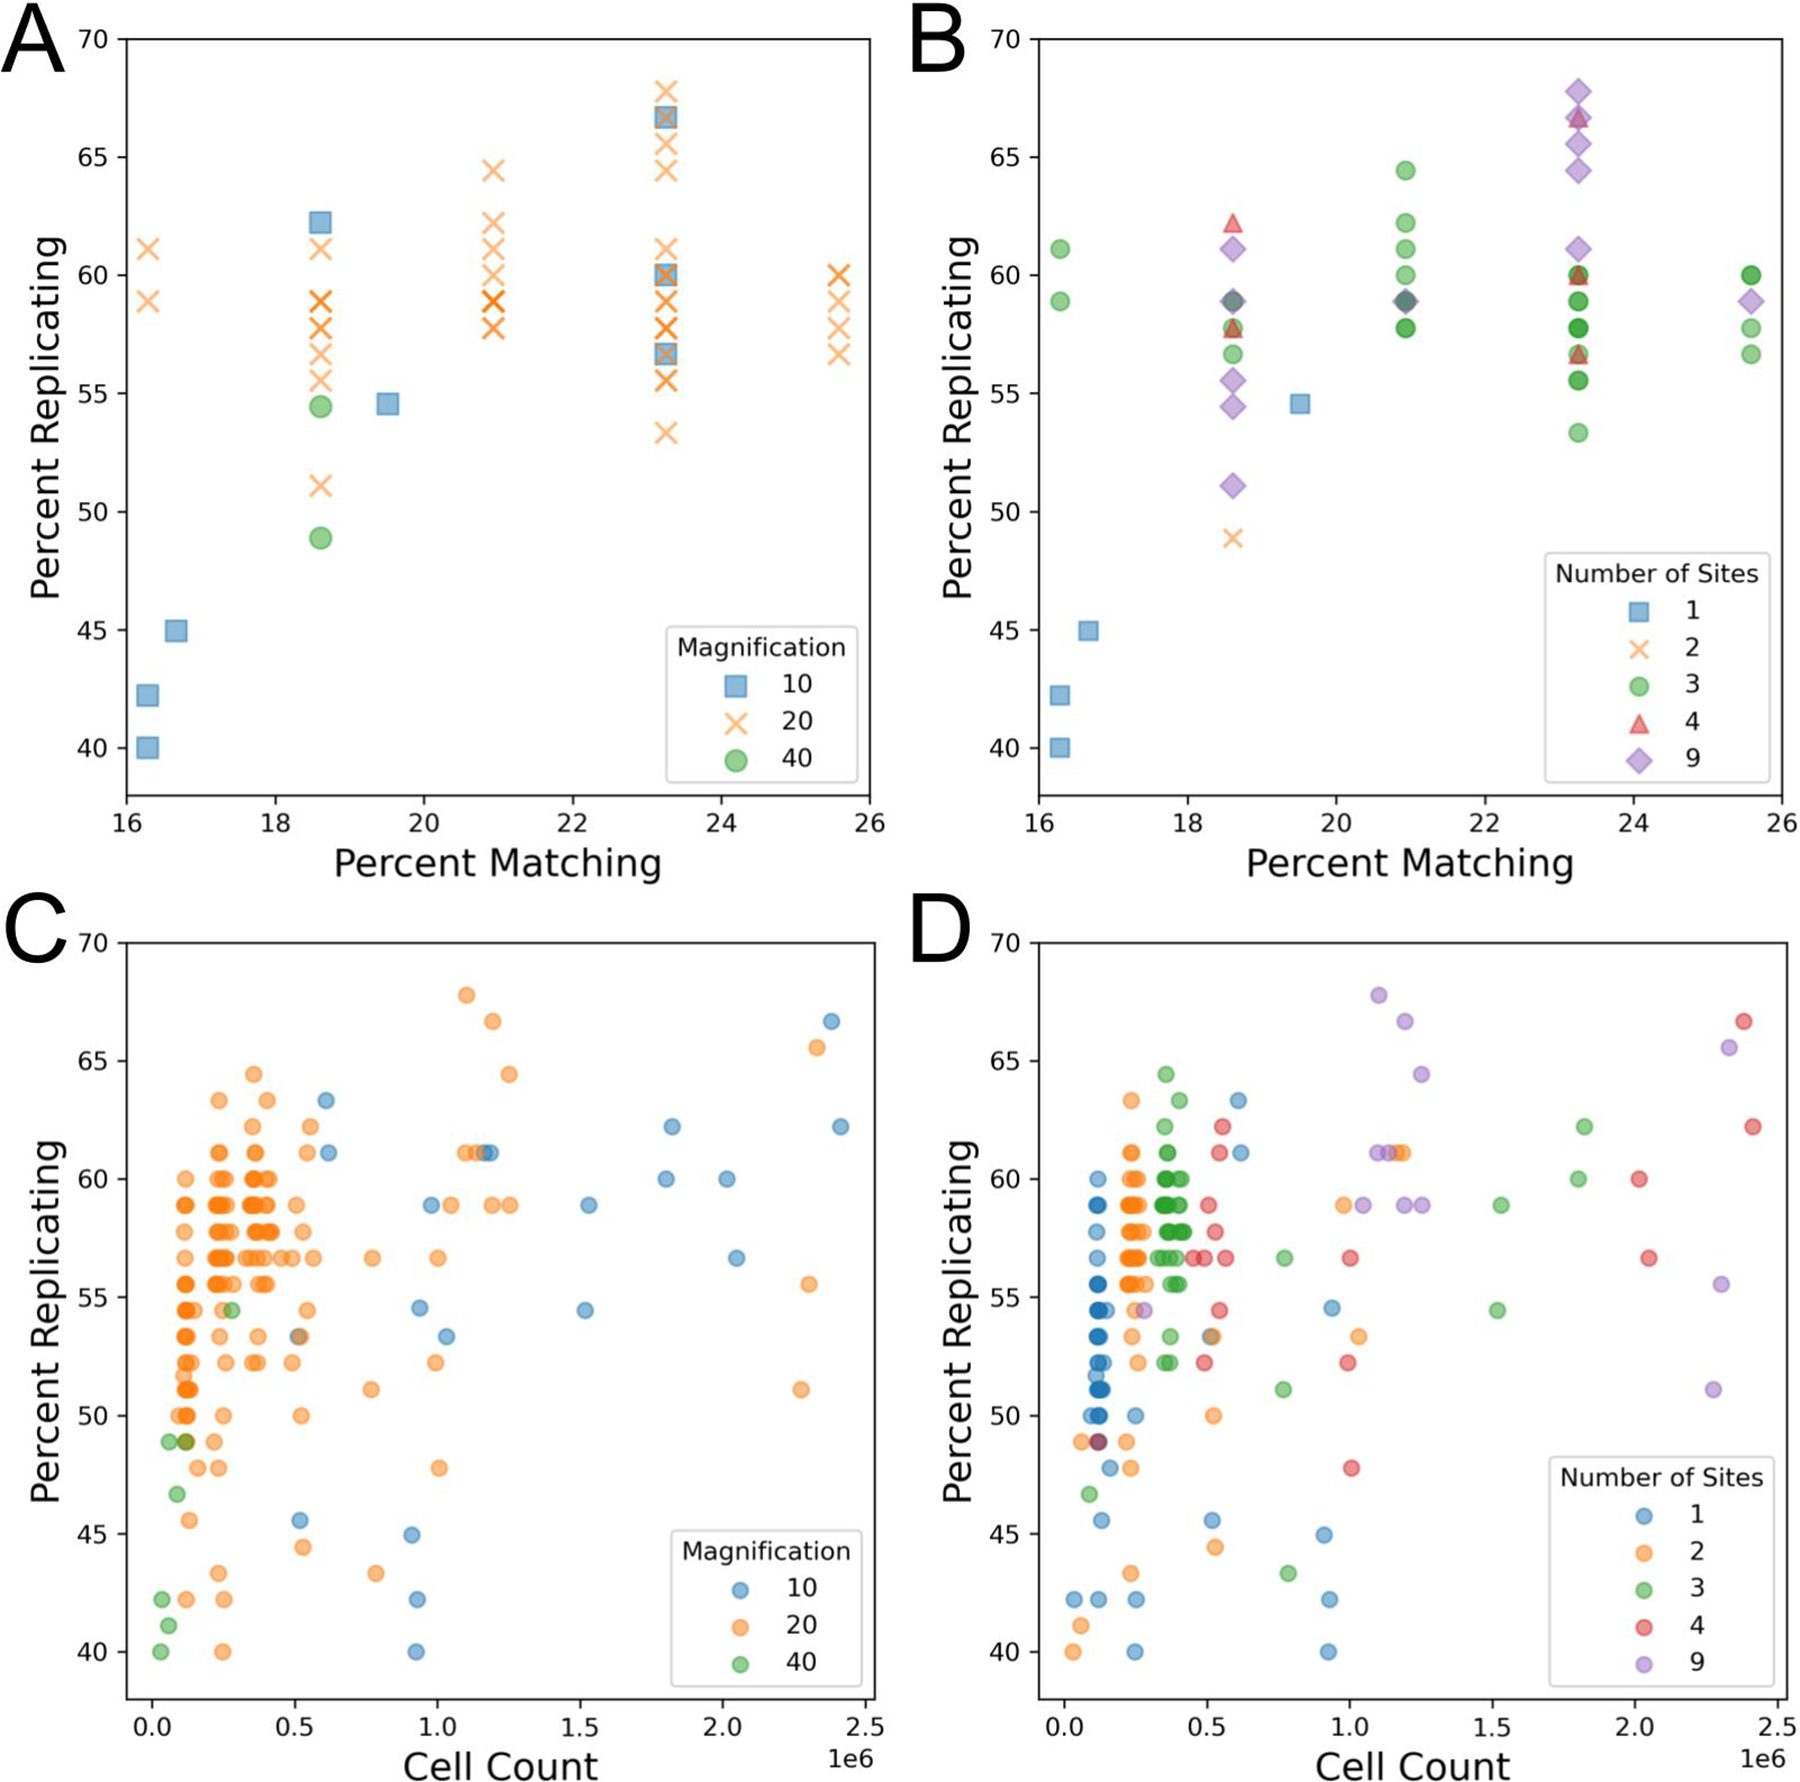
Impact of magnification, number of imaged sites, and cell count on technical quality of the Cell Painting assay. Each data point represents one 384-well plate. Note that the data points are the same in A + B and in C + D but the color labeling changes in each.
(A) Comparison of objective magnification in the Cell Painting assay. Because all plates contain the same finite number of replicates and matches, some data points match exactly.
(B) Profile strength increases with the number of sites taken per well.
(C) An increase in cell count typically leads to an increase in profile strength, leveling off around one million cells. Plot includes artificially site-subsampled data. Cell count shown is sum across all wells.
(D) An increase in cell count and profile strength is associated with an increase in the number of sites taken per well. Cell count shown is sum across all wells.