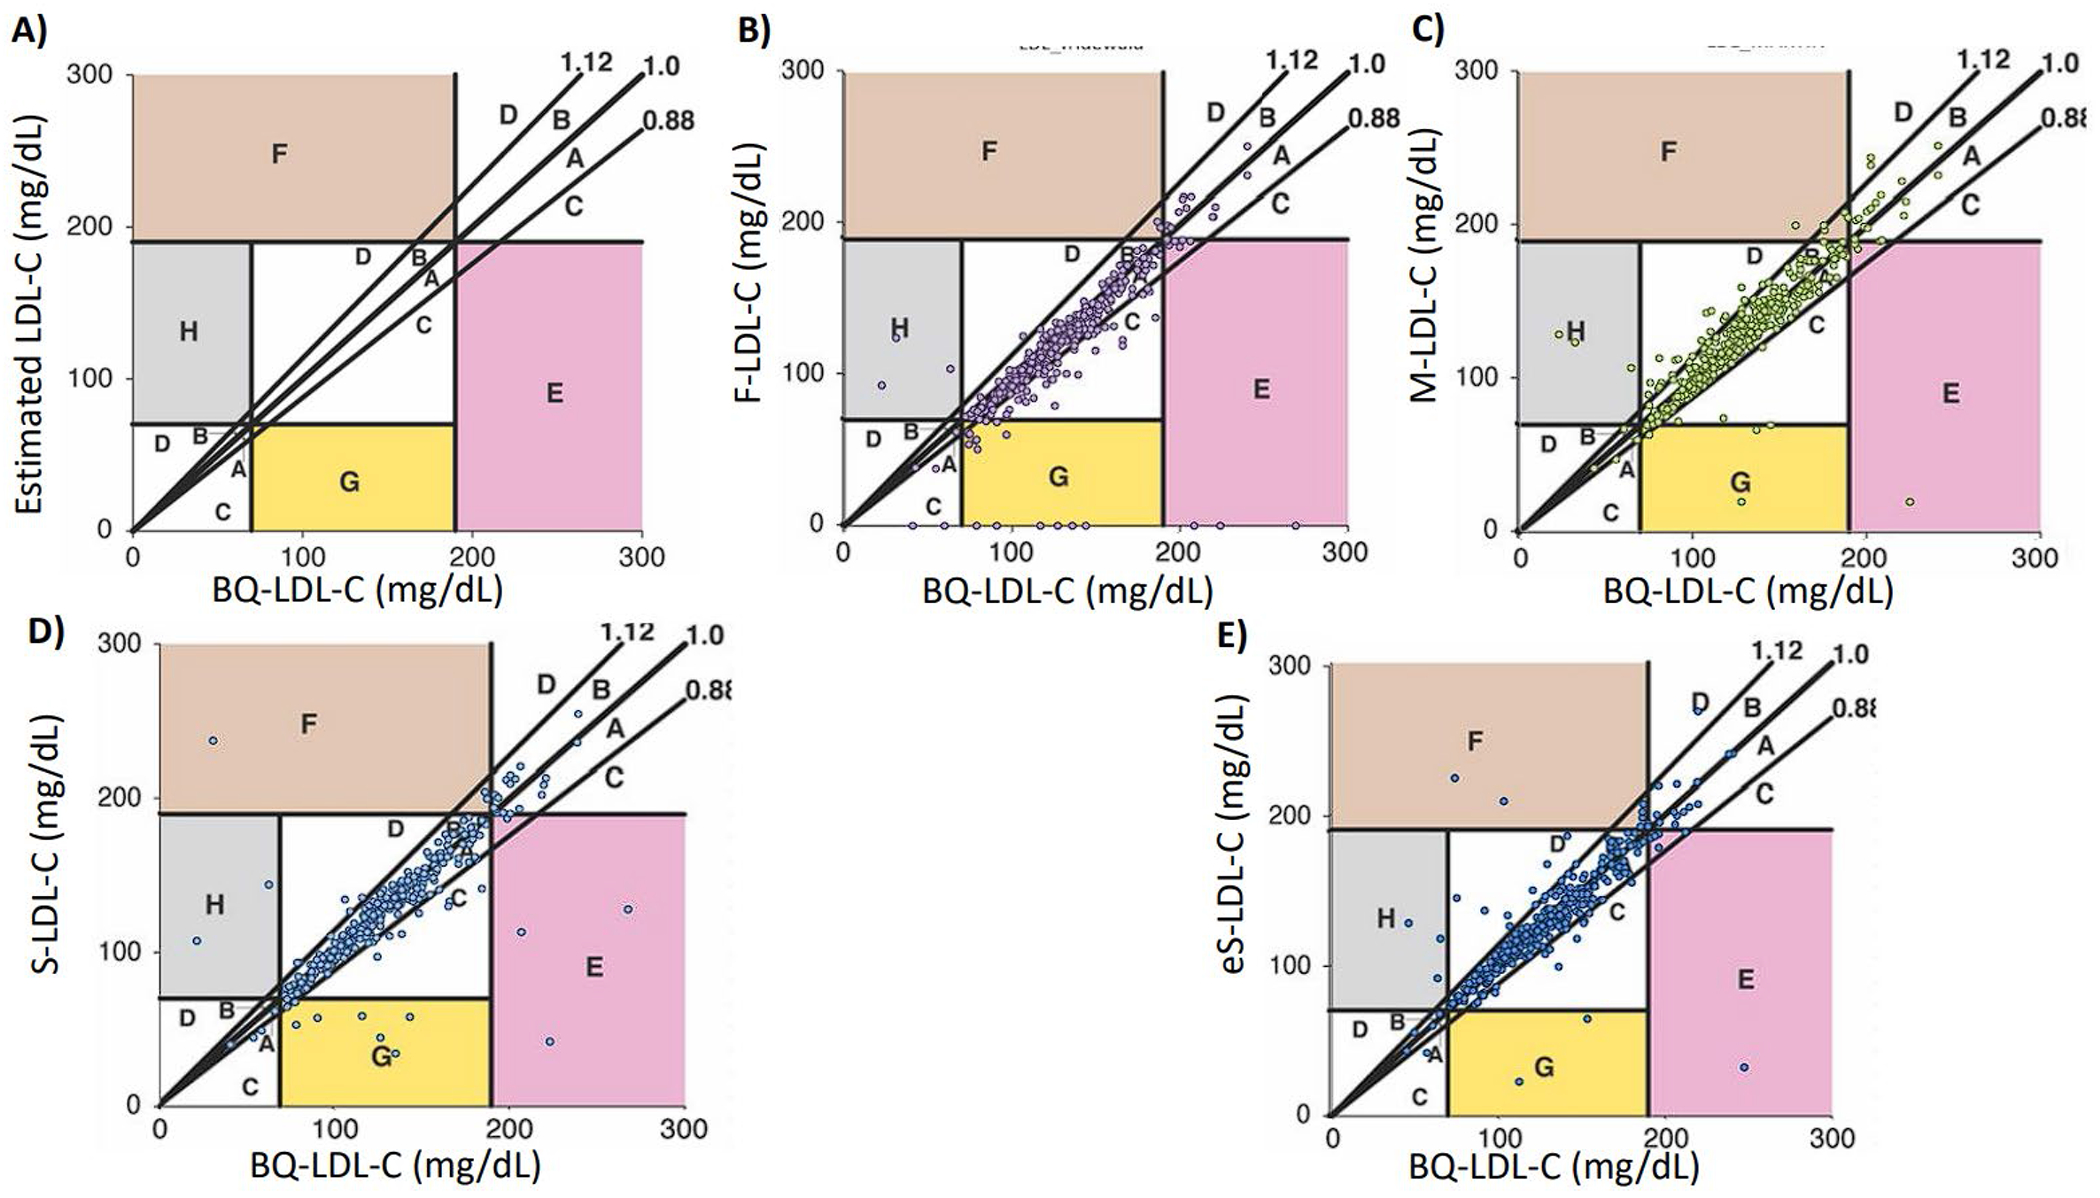
Figure 3. Error Grid Analysis for overall population.

Definition of errors are shown in (Panel A). a: Within 12% proportional error and below regression line, b: Within 12% proportional error and above regression line, c: Greater than 12% proportional error but no impact on patient management and below regression line, d: Greater than 12% proportional error but no impact in patient management and above regression line, e: Underestimation of LDL-C at high LDL-C cut-point leading to error in patient management, f: Overestimation of LDL-C at high LDL-C cut-point leading to error in patient management, g: Underestimation of LDL-C at low LDL-C cut-point leading to error in patient management, h: Overestimation of LDL-C at low LDL-C cut-point leading to error in patient management. Negative values are shown as zero. Numbers in colored zones (e, f, h and g) indicate the total number of clinically relevant misclassifications (10). Overall patients (N = 336) LDL-C was calculated for Friedewalds (Panel B), Martin or enhanced Martin if TG >400 mg/dL (Panel C), Sampson’s (Panel D) or calculated enhanced Sampson’s (Panel E). Abbreviations: LDL-C: Low density lipoprotein cholesterol, BQ-LDL-C: ultracentrifugation measured LDL-C.
