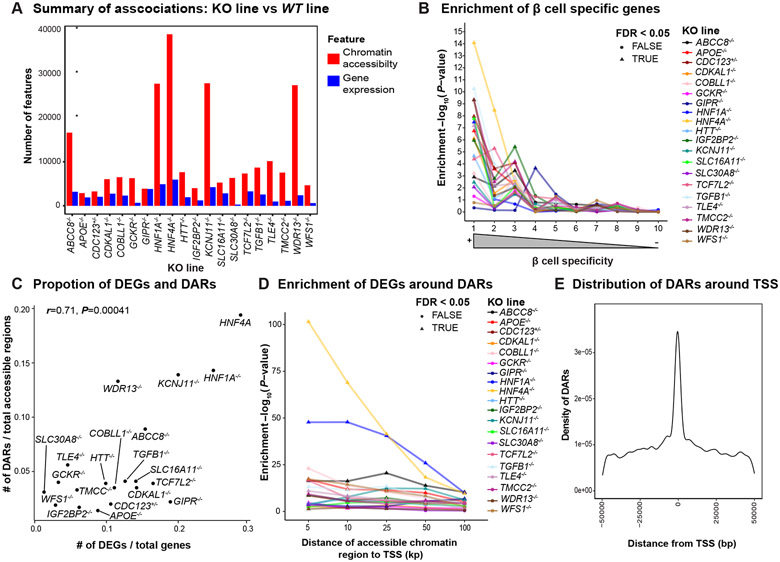
Figure 2. Loss of T2D associated genes results in large scale transcriptomic and epigenetic changes in hESC-β cells.
(A) Summary of differential gene expression (blue) and differential chromatin accessibility (red) in β-like cells. (B) Enrichment of DEGs in β-cell specific genes. (C) Correlation of DEGs and DARs. (D) Enrichment of DEGs around DARs in varying sizes of windows. (E) Distribution of accessible chromatin regions associated with nearby gene expression. For panels 2B and 2D, we applied the Benjamini-Hochberg procedure to correct for multiple hypotheses testing across all KO lines and highlighted the enrichment at FDR< 0.05 with triangles.

