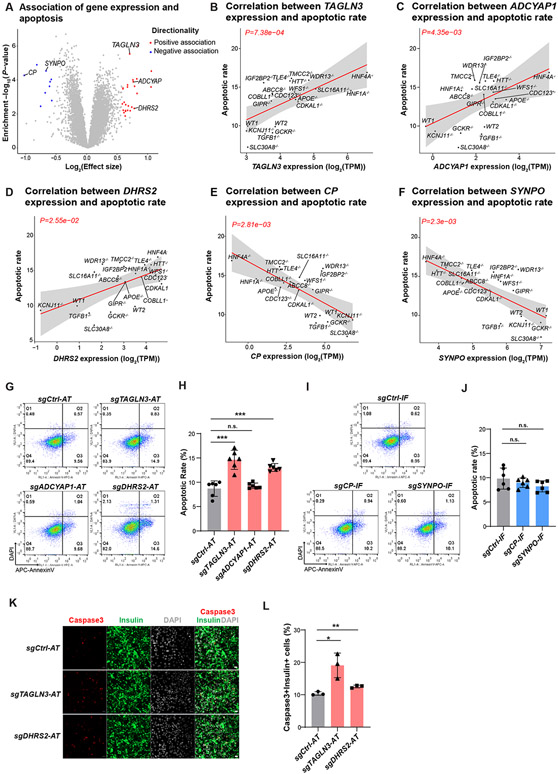
Figure 5. Cellular trait association analysis identifies genes controlling β-cell survival.
(A) Identification of genes correlated with palmitate-induced apoptotic rate in hESC-β cells. Genes associated at FDR<0.05 and ∣effect size∣>1.5 are colored (negative: blue, positive: red). (B-F) Linear regression analysis of apoptotic levels in each WT or KO line with RNA expression of candidate genes TAGLN3 (B), ADCYAP1 (C), DHRS2 (D), CP (E) and SYNPO (f). The solid line and gray area indicate the regression line and 95% CI, respectively. (G-J) Representative flow cytometry analysis (G and I) and the percentage of AnnexinV+DAPI− cells (H and J) in genetic perturbed EndoC-βH1 cells after palmitate treatment. Gating strategy is shown in Figure S6D. N=6 biological replicates. (K and L) Representative Immunofluorescent staining images (K), and the percentage of cleaved-caspase3+Insulin+ cells (L), in EndoC-βH1 cells carrying sgRNA to activate TAGLN3 or DHRS2. N=3 biological replicates. Scale bar = 200 μm. For panels 5H, 5J and 5L, data are shown as mean ± SD. P-values were calculated by unpaired Student’s t-test. The n.s. indicates a non-significant difference and * symbol illustrates the difference of each genetic perturbation line compared to the control line. * P < 0.05, ** P < 0.01, ***P < 0.001, ****P < 0.0001.

