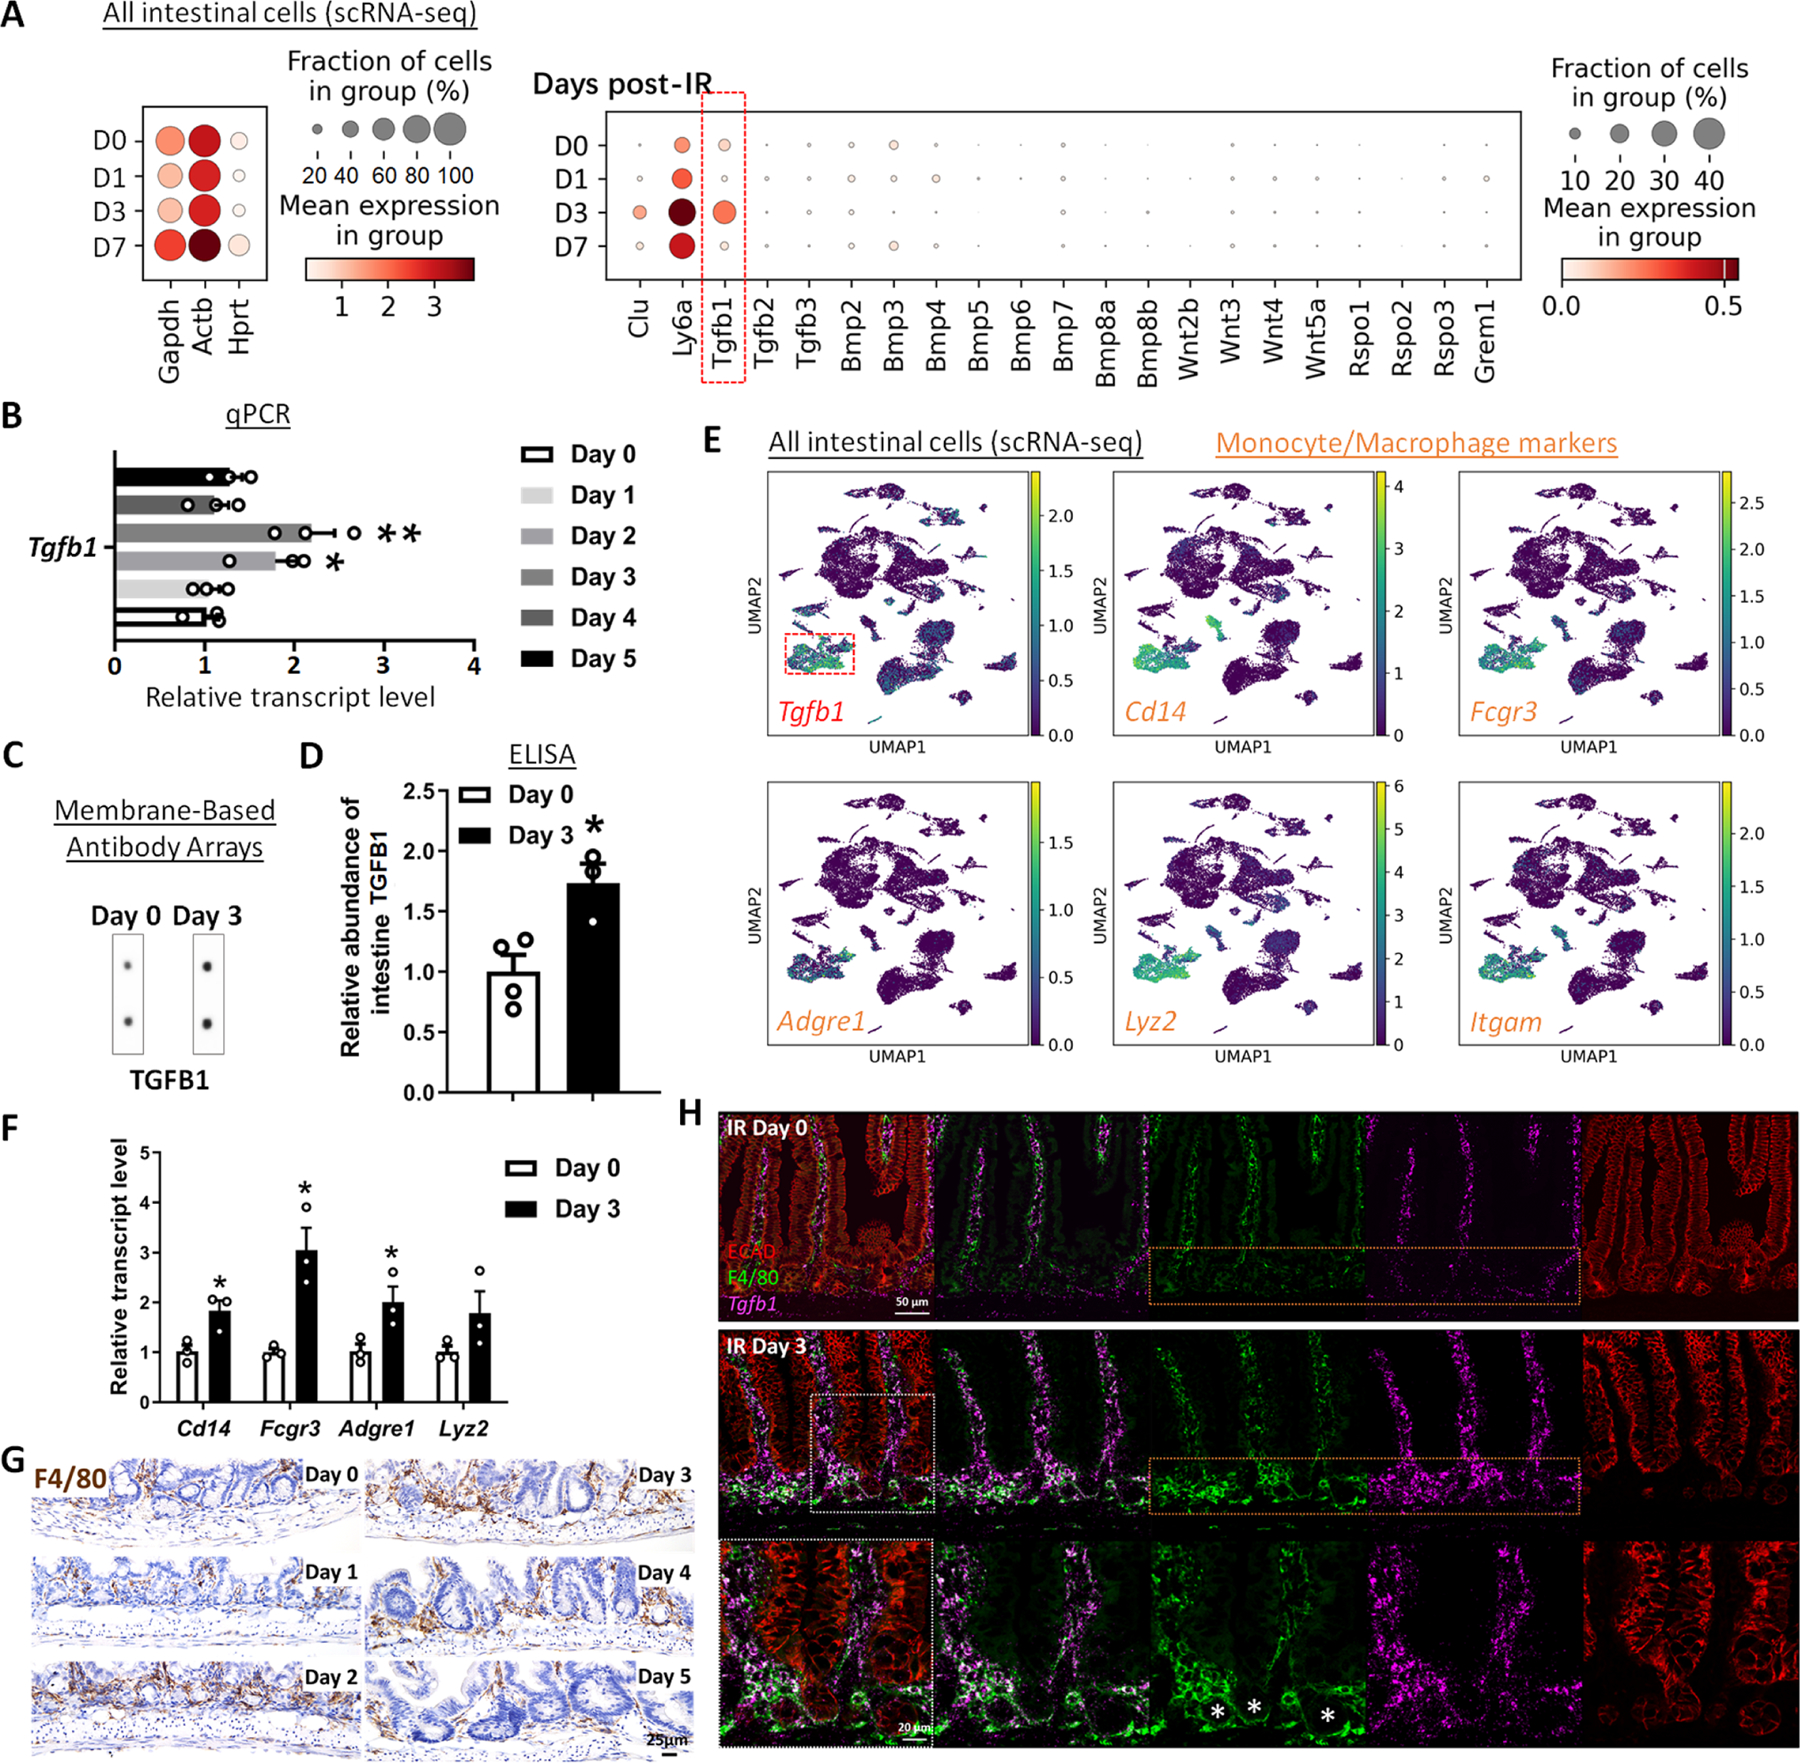
Figure 2. TGFB1 is highly enriched in Day 3 irradiated mouse intestine, and monocytes/macrophages are likely the main cell source of TGFB1.

(A-C) Tgfb1 transcript is notably enriched in the intestine at 3 days post-irradiation. (A) Dot plots of scRNA-seq data following mouse irradiation at days 0, 1, 3, and 7: GSE165318, duodenum/jejunum boundary, n=3–4 biological replicates per time point) indicate that among secreted regulators of the TGF/BMP/WNT signaling pathways, transcripts corresponding to Tgfb1 are the most upregulated during regeneration of the gut (red box) and overlap expression of epithelial regenerative markers Clu and Ly6a. (B) Elevated Tgfb1 transcript levels are observed at days 2 to 3 post-irradiation. The qRT-PCR data are presented as mean ± SEM (n=3 biological replicates, whole duodenal fragments). Transcript levels are relative to Day 0 (before IR), statistical comparisons were performed using one-way ANOVA followed by Dunnett’s post at P < 0.01** or P < 0.05*. See schematic of experimental design in Figure S2A. (C-F) TGFB1 protein levels are elevated in the intestine at Day 3 post-irradiation. (C) Membrane-based antibody arrays: n=2 independent experiments, 2 technical replicates per membrane (See full blots in Figure S2B). (D) ELISA to measure TGFB1: Data are presented as mean ± SEM (n=3–4 biological replicates, duodenal fragments, Student’s t-test at P < 0.05*). (E) UMAP projection of all cells identifies a cell cluster expressing highest levels of Tgfb1, and these Tgfb1-expressing cells co-express markers of monocytes/macrophages. Cells per time point: D0: n=4415; D1: n=2995; D3: n=7368; D7: n=3783; D14: n=2220 (GSE165318). (F) qRT-PCR corroborates elevation of transcript levels of monocyte/macrophage marker genes at 3 days post-IR. All qRT-PCR data are presented as mean ± SEM (n=3 biological replicates, duodenal fragments, Student’s t-test at P < 0.05*). (G) Tissues from mice at different days post-12 Gy irradiation were probed for the monocyte/macrophage marker F4/80 using immunohistochemistry. An increase in F4/80 cells (brown color) occurs when the tissue begins to heal at 2 days post-IR (representative of 3 biological replicates, see quantification in Figure S2I). (H) RNAscope localized Tgfb1 transcripts relative to immunostaining signal from ECAD (epithelial marker) and F4/80 (representative of 3 biological replicates). Co-stains reveal that F4/80-marked macrophages are associated with damaged crypt epithelium at day 3 post-IR and overlap with regions of elevated levels of Tgfb1, suggesting that monocyte/macrophages are recruited to the damaged tissue and produce TGFB1.
