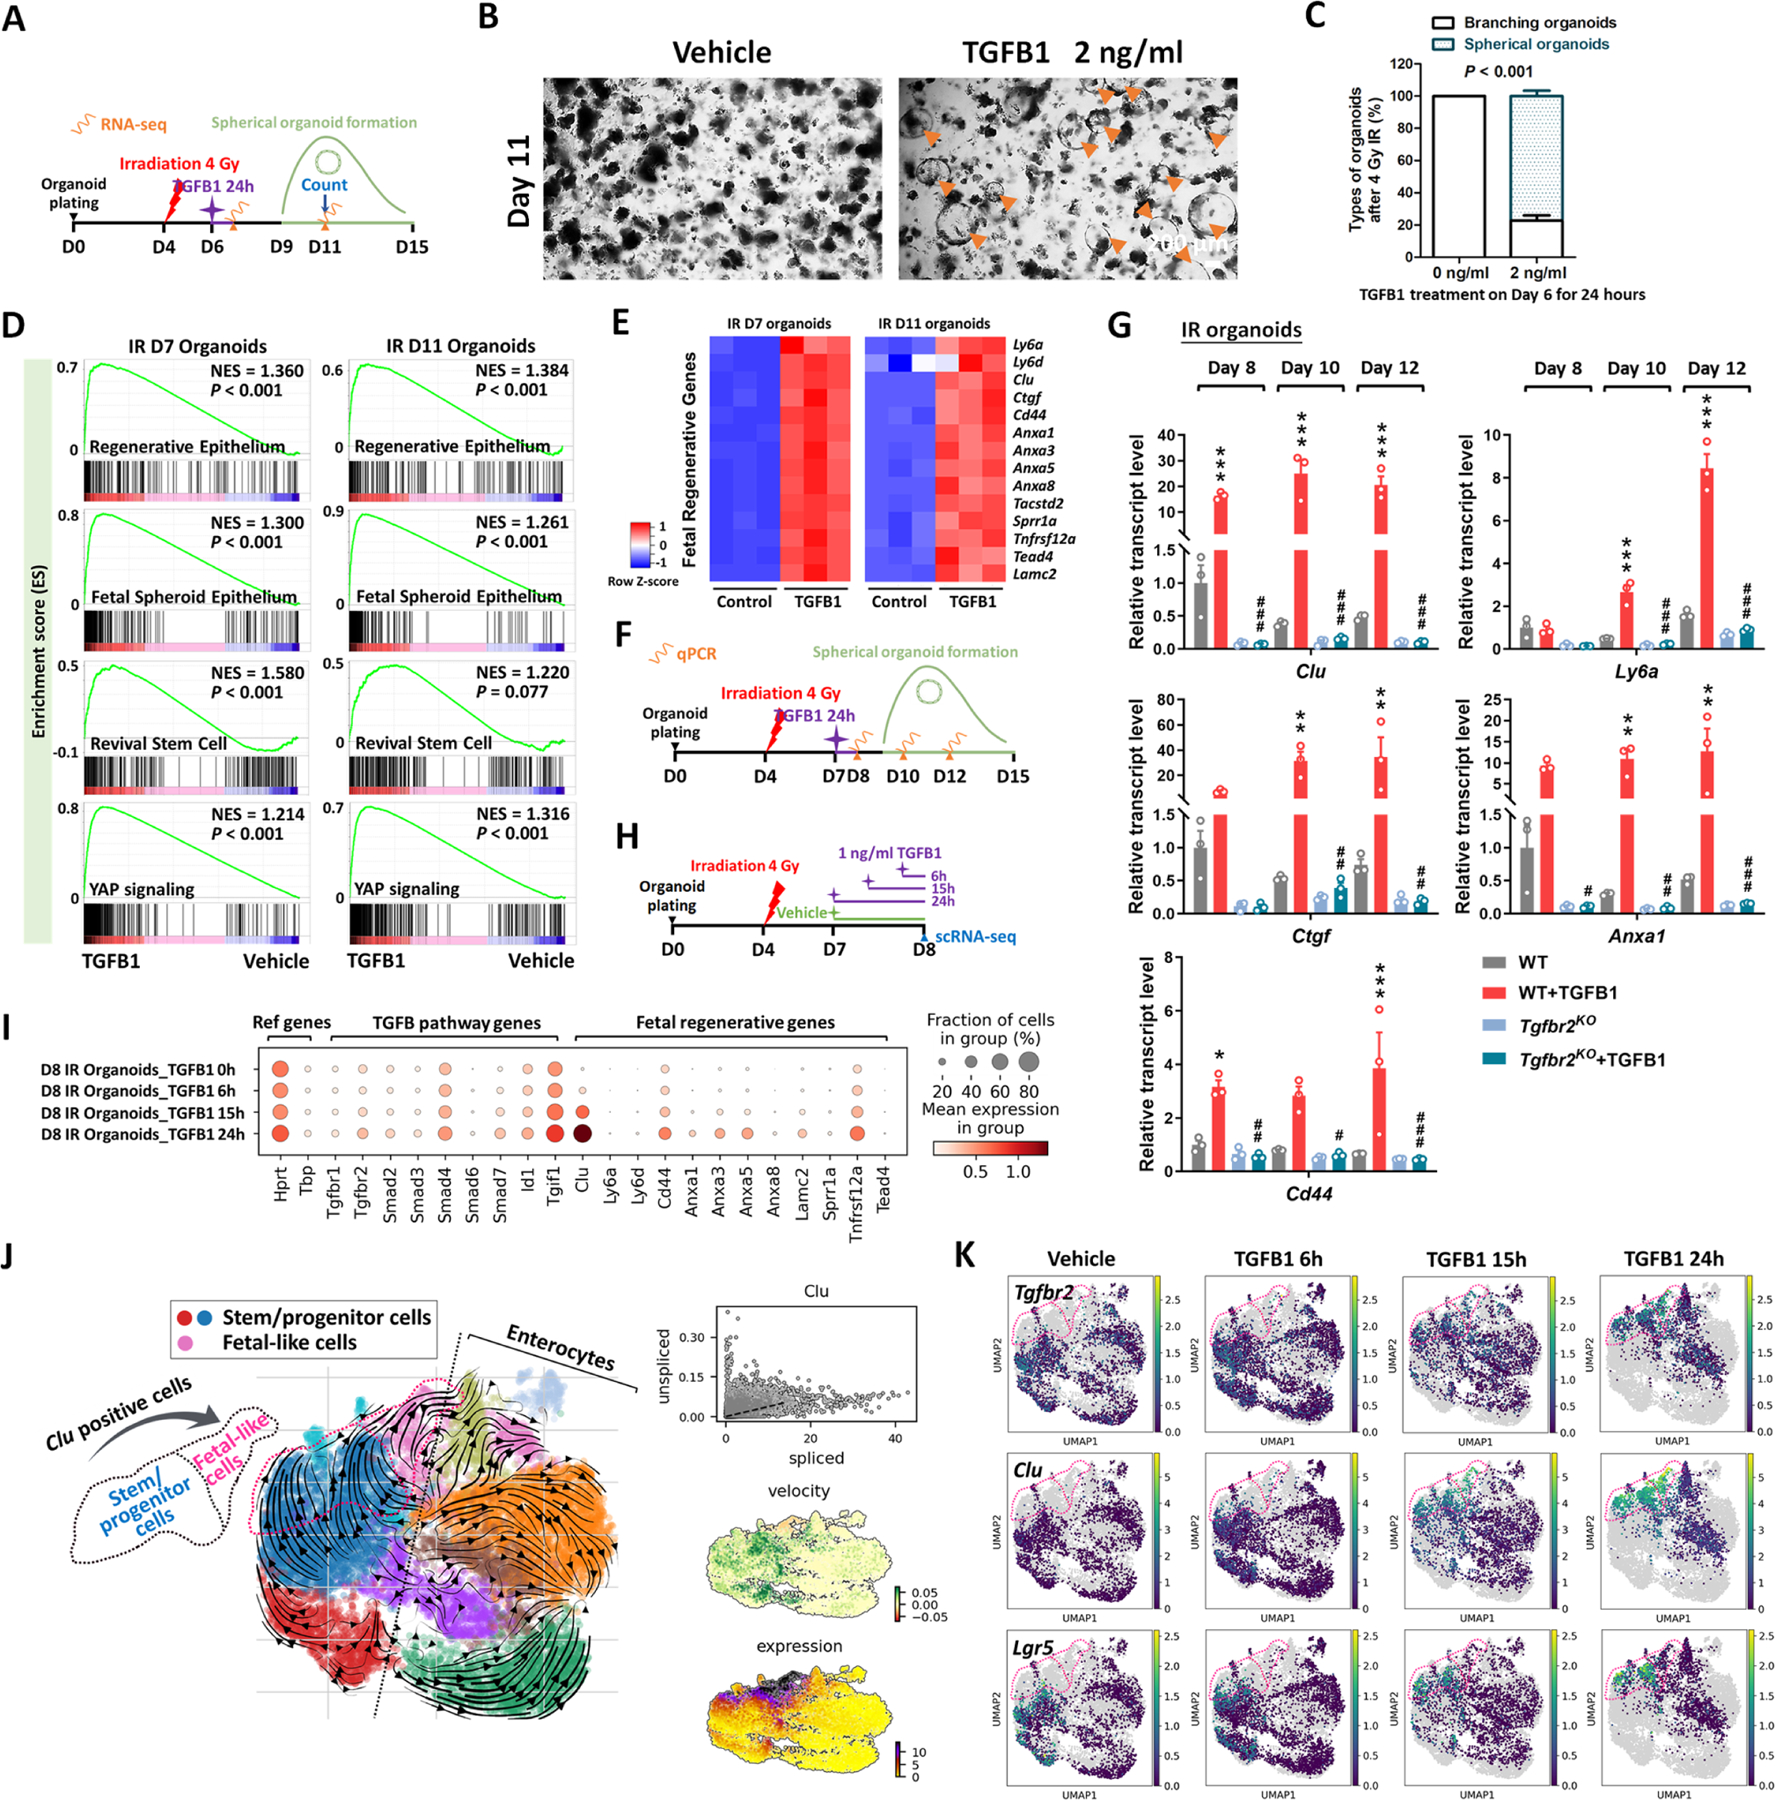
Figure 4. TGFB1 is sufficient to induce fetal/regenerative gene signatures and increase Clu positive cells in organoid culture.

(A-E) Organoids treated with TGFB1 for 24 hours acquire a spheroid morphology (see orange arrows in panel B) and maintain expression of regeneration marker genes for at least 5 days post-TGFB1 treatment. (A) Schematic for the experiments to score morphology, counts, and bulk RNA-seq. Primary intestinal organoids were exposed to 4 Gy of irradiation on Day 4, followed by TGFB1 treatment on Day 6 for 24 hours. Organoids were collected for bulk RNA-seq on Day 7 and Day 11. (B) Representative images of irradiated organoids treated with vehicle or TGFB1. (C) Percentage of branching and spherical organoids upon TGFB1 treatment. Organoids were counted at Day 11, which is 5 days post-TGFB1 treatment (n=3 independent organoid cultures, Student’s t-test at P < 0.001). (D) Bulk RNA-seq of intestinal organoids cultured with TGFB1 for 24 hours show strong correlation with published gene signatures associated with intestinal regeneration post-DSS injury, fetal spheroid, revival stem cells and YAP signaling,8,12,13,17,89 as measured by GSEA (n=3 independent organoid cultures, Kolmogorov-Smirnov test). (E) Heatmaps display that RNA-seq expression levels of fetal/regenerative genes are highly expressed upon TGFB1 treatment compared to the vehicle controls (n=3 independent organoid cultures). (F) Schematic for the qRT-PCR experimental design. Primary intestinal organoids cultured from Tgfbr2KO mice (4 days post-tamoxifen) and their littermate WT controls, were exposed to 4 Gy of irradiation on Day 4, followed by TGFB1 treatment (1 ng/ml) on Day 7 for 24 hours. Organoids were collected on Day 8, Day 10 and Day 12 for qRT-PCR. (G) qRT-PCR indicates that expression of regeneration marker genes increases within 24 hours and is sustained for at least 5 days post-TGFB1 treatment in the WT organoids, but not in the Tgfbr2KO organoids. See more examples in Figure S4A. All the data are presented as mean ± SEM (n=3 independent organoid cultures). Statistical comparisons were performed using one-way ANOVA followed by Tukey’s multiple comparisons test at P < 0.001***, P < 0.01** or P < 0.05* (WT+TGFB1 vs WT); P < 0.001###, P < 0.01## or P < 0.05# (Tgfbr2KO+TGFB1 vs WT+TGFB1). (H-K) scRNA-seq of organoids post-irradiation and upon TGFB1 treatment across time points. (H) Schematic of scRNA-seq experimental design. Primary intestinal organoids were exposed to 4 Gy of irradiation on Day 4, followed by TGFB1 treatment (1 ng/ml) on Day 7. Organoids were collected for scRNA-seq after 6, 15, and 24 hours of TGFB1 treatment. Organoids treated with vehicle were used as control. (I) Dot plots show that TGFB1 activates TGFB pathway and fetal/regenerative genes in a time-dependent manner. (J) RNA velocity analysis identifies that cells in Lgr5-expressing clusters are synthesizing new Clu transcripts. (K) UMAP plots indicate that, across time points, there is a close correlation between Clu and Tgfbr2 expression. Lgr5-expressing clusters begin to overlap with Clu-expressing cells. Number of cells in each condition was Vehicle: n= 2815; TGFB1 6h: n= 4071; TGFB1 15h: n= 2788; TGFB1 24h: n=2177.
