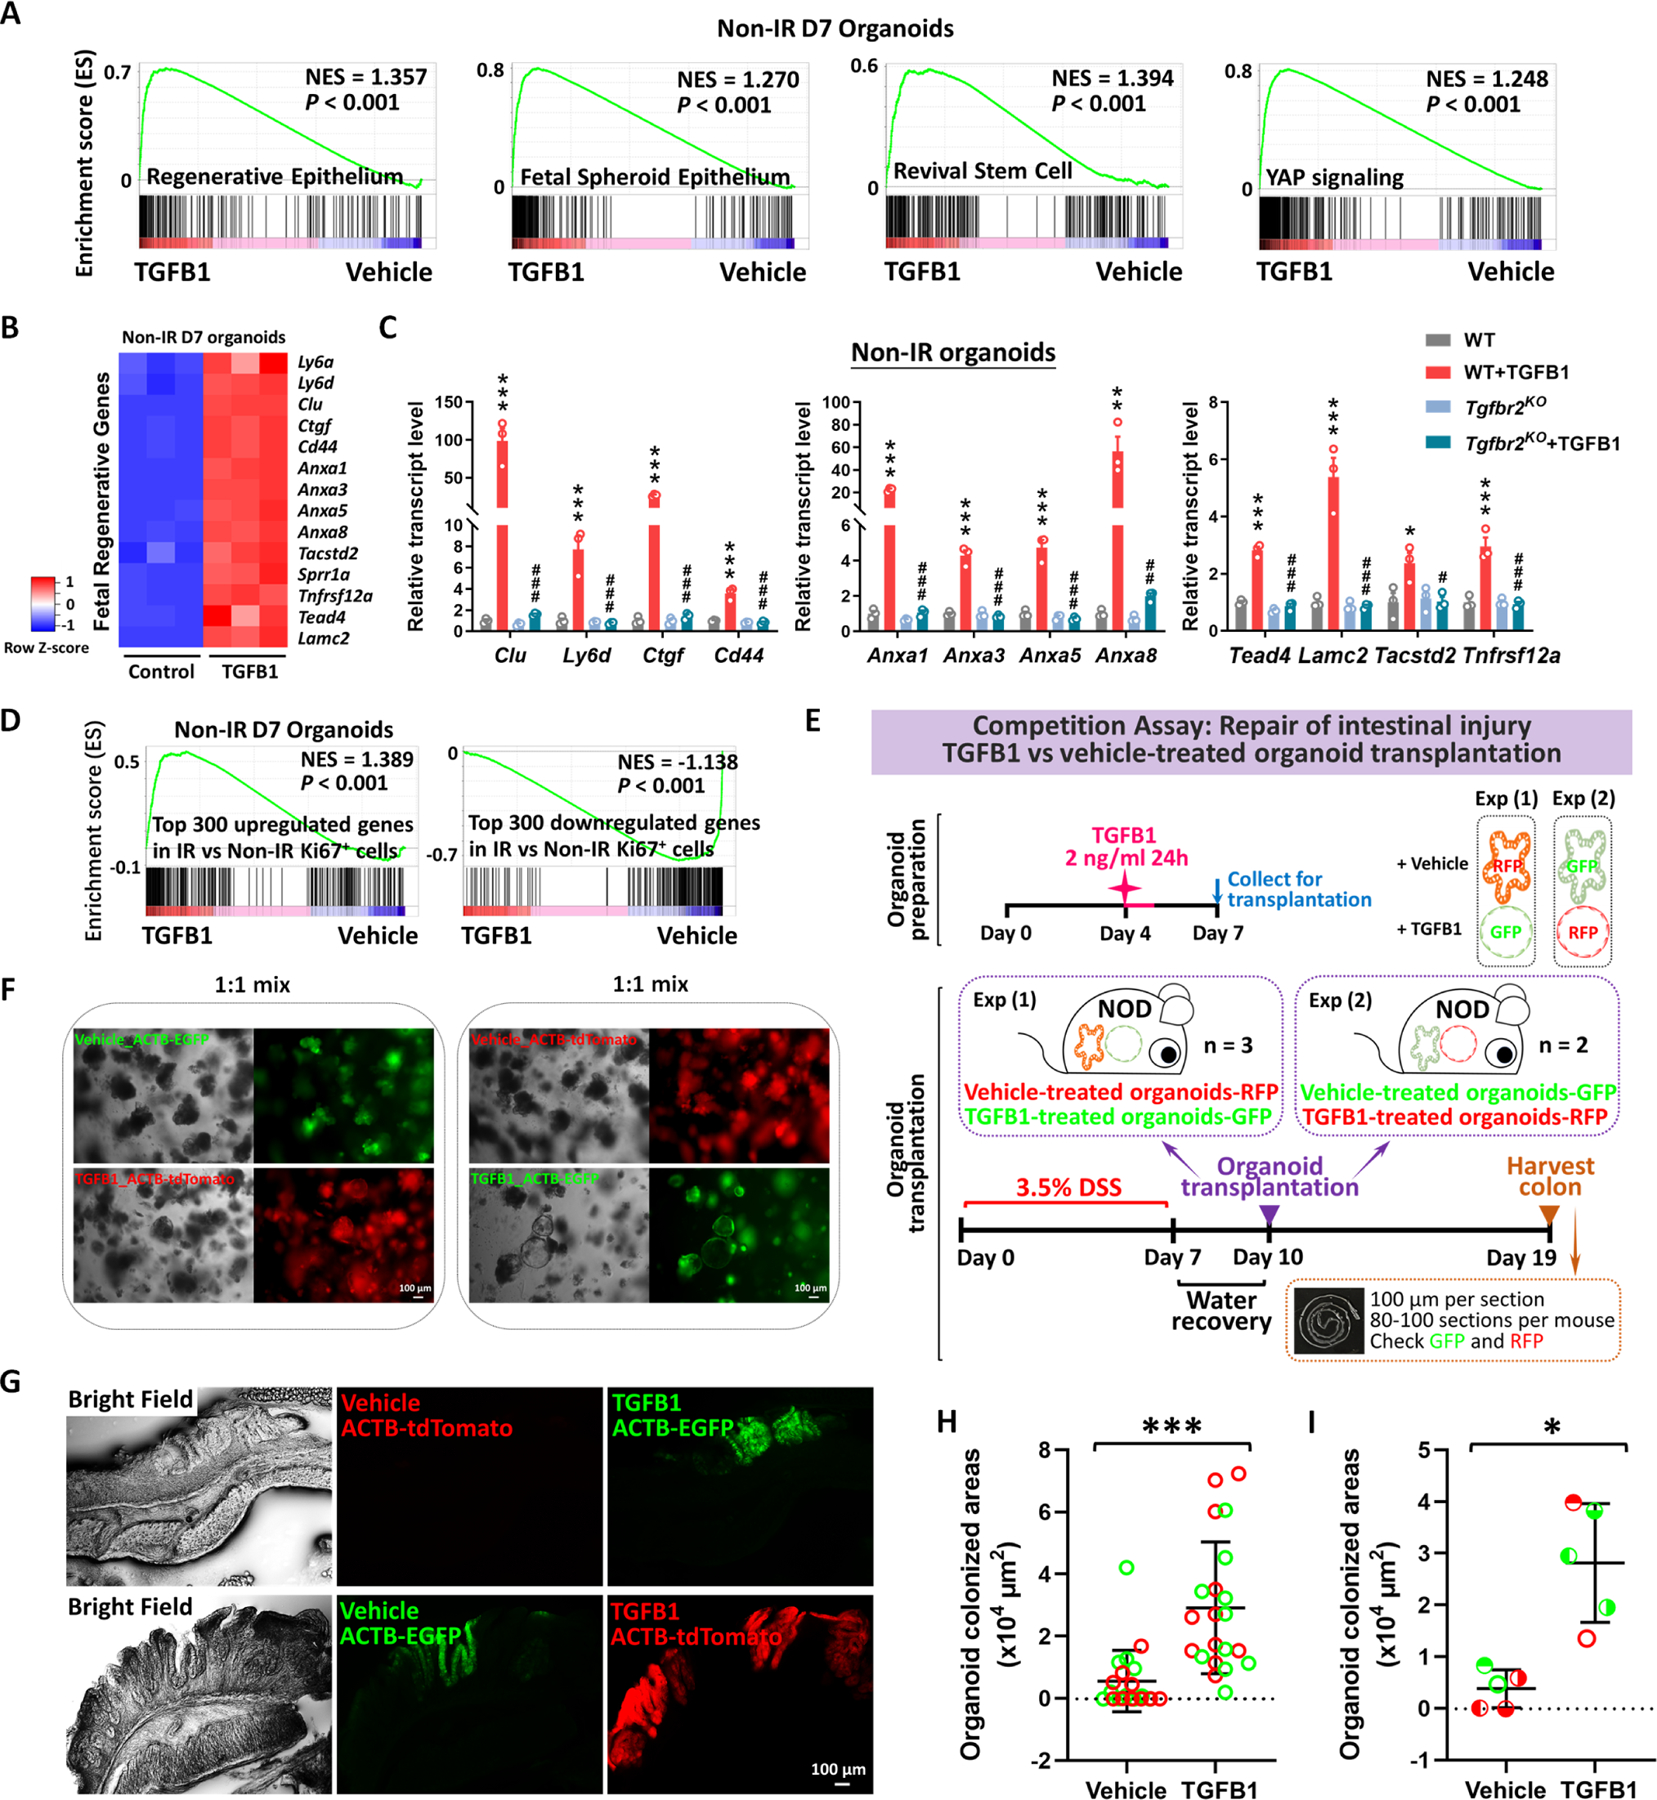
Figure 7. Transplantation of TGFB1-treated organoids enhances engraftment into DSS-treated mice.

(A) Gene signatures of regenerative epithelium, fetal spheroids, revival stem cells and YAP signaling8,12,13,17,89 are each elevated post-TGFB1 treatment, as assayed by GSEA in non-irradiated conditions (n=3 independent organoid cultures, Kolmogorov-Smirnov test, P < 0.001). (B) Heatmaps display that RNA-seq expression levels of fetal/regenerative genes are highly expressed upon TGFB1 treatment compared to the vehicle controls (n=3 independent organoid cultures). Schematic of experimental design for bulk RNA-seq for panels A-B is depicted in Figure S7A. (C) For non-IR organoids, to deplete Tgfbr2, the primary organoids were treated with 1 μM tamoxifen for 12 hours on Day 3, followed with TGFB1 (2 ng/ml) treatment on Day 6. Organoids were collected 24 hours after TGFB1 treatment. All the data are presented as mean ± SEM (n=3 independent organoid cultures). Statistical comparisons were performed using one-way ANOVA followed by Tukey’s multiple comparisons test at P < 0.001***, P < 0.01** or P < 0.05* (WT+TGFB1 vs WT); P < 0.001###, P < 0.01## or P < 0.05# (Tgfbr2KO+TGFB1 vs WT+TGFB1). (D) GSEA reveals that genes upregulated or downregulated upon TGFB1 treatment strongly correlate with transcriptional changes in Ki67-RFP cells from the intestine of mice with irradiation vs. non-irradiation, respectively, as described in Figure 1 (Kolmogorov-Smirnov test, P < 0.001, n=3 independent organoid cultures). (E) Experimental design for organoid transplantation assay, to determine the ability of TGFB1 to prime organoids in culture prior to transplantation for engrafting into damaged colonic tissue. Transgenic organoid lines were used to later help visualize transplants. Organoids were treated with either vehicle or with TGFB1 to induce regenerative properties. To induce epithelial damage in the mouse intestine, 3.5% DSS was prepared in drinking water and fed to NOD mice for 7 days. After a period of water recovery, the treated and control organoids were mixed 1:1 and used for enema-based transplant. Either vehicle-treated organoids with RFP were mixed with TGFB1-treated organoids with GFP; or vehicle-treated organoids with GFP were mixed with TGFB1-treated organoids with RFP. Organoid mixtures were transferred into DSS-treated mice on Day 10. Colon tissues were collected on Day 19, and cryosections were prepared for checking GFP or RFP under fluorescence microscope. (F) Representative images of organoids used for transplantation. (G-I) Representative images and quantification of transplant efficiency upon TGFB1 pre-treatment. (G) Fluorescent micrographs demonstrating transgenic organoid grafts into mice. (H) The size of grafts observed. (I) The average area of organoid grafts per mouse. Color indicates whether transplanted organoids derived from red or green fluorescent lines. Symbol type represents a single mouse used in the competition assay (n=21 grafts from 5 mice, Student’s t-test at P < 0.001*** or P < 0.05*).
