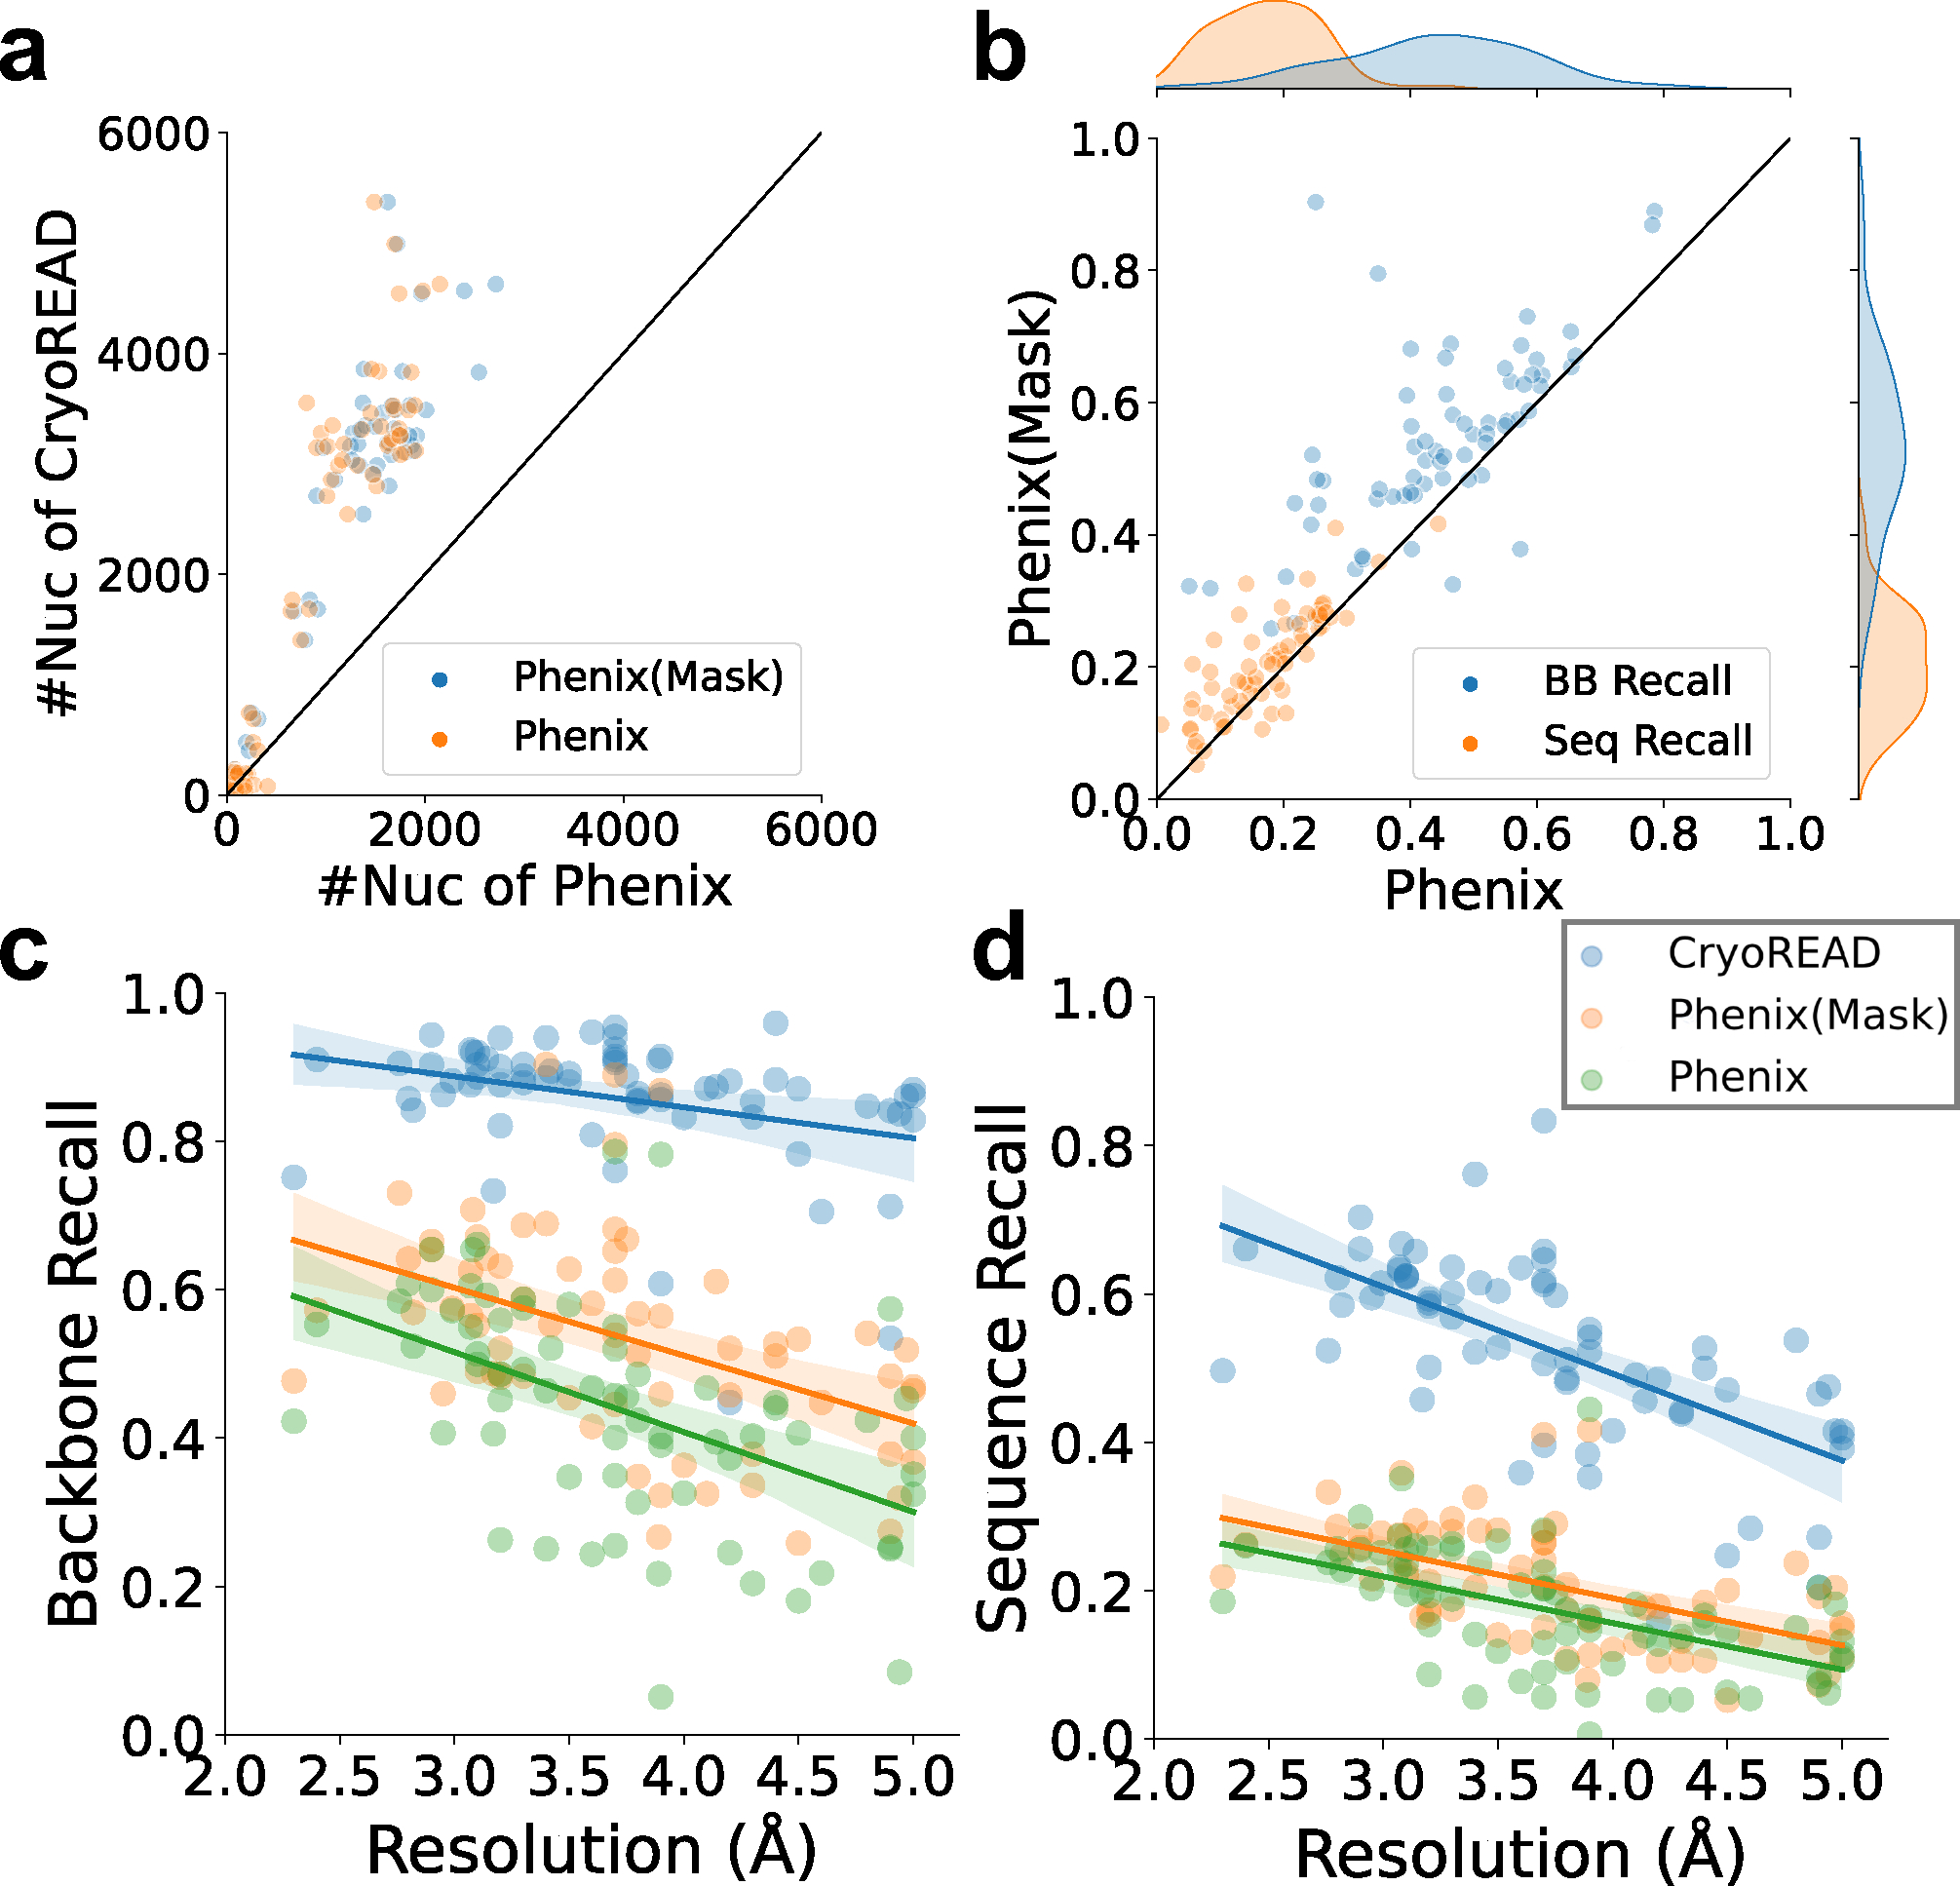
Extended Data 10. Structure model evaluation on the 68 experimental EM maps with Phenix.

a, the number of nucleotides modelled by Phenix map_to_model and CryoREAD. For Phenix results, two models were generated. Models from map regions that are predicted to include nucleic acid atoms (Phenix (Mask), blue) and models that were built from the entire map (Phenix, orange). b, comparison of backbone atom/sequence recall of Phenix (Mask) and Phenix. c, backbone atom recalls of Phenix (Mask), Phenix, and CryoREAD relative to map resolution. For CryoREAD, the equation of regression line is (Pearson correlation coefficient: −0.320, p-value: 0.008, standard error:0.015). For Phenix(Mask), the equation of regression line is (Pearson correlation coefficient: −0.445, p-value: 1.456e-4, standard error:0.023). For Phenix, the equation of regression line is (Pearson correlation coefficient: −0.492, p-value: 2.006e-5, standard error:0.023). d, sequence recalls of Phenix (Mask), Phenix and CryoREAD relative to map resolution. For CryoREAD, the equation of regression line is (Pearson correlation coefficient: −0.632, p-value: 7.280e-9, standard error:0.017). For Phenix(Mask), the equation of regression line is (Pearson correlation coefficient: −0.550, p-value: 1.190e-6, standard error:0.012). For Phenix, the equation of regression line is (Pearson correlation coefficient: −0.525, p-value: 4.254e-6, standard error:0.013).
