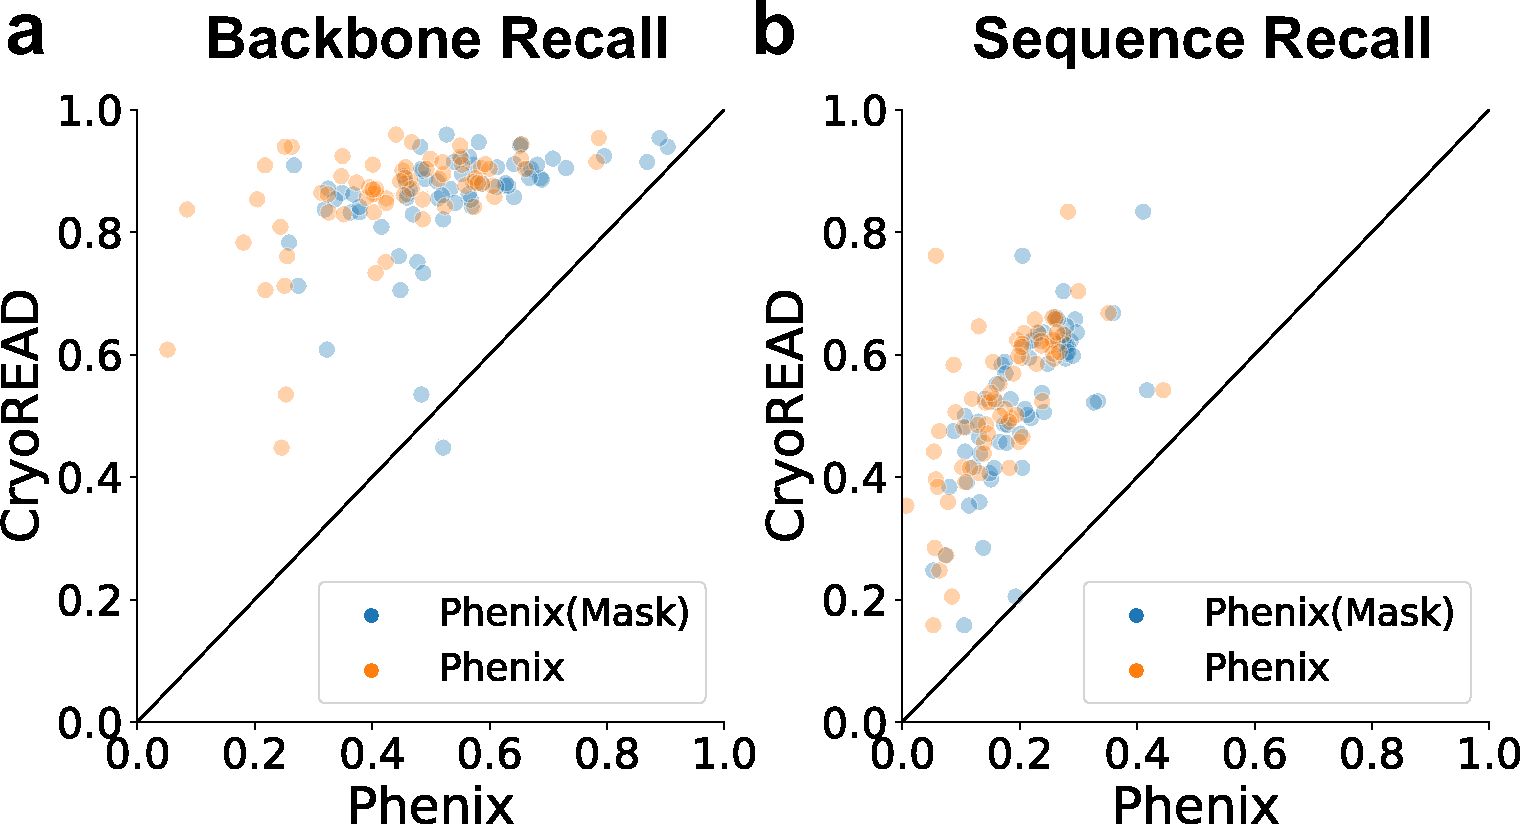
Fig. 5. Comparison with models by Phenix.

We ran the Phenix map_to_model tool in two settings. The default setting is to provide the same EM maps as input as CryoREAD (orange data points, Phenix). We also provided segmented regions of the map, which are voxels that are predicted to include nucleotides, i.e. sugar, phosphate, or bases (blue data points, Phenix (Mask)). The benchmark dataset with 68 maps were used for these plots. a, backbone recall. b, sequence recall. Other comparison data are provided in Extended Data 10 and Supplementary Table 6.
