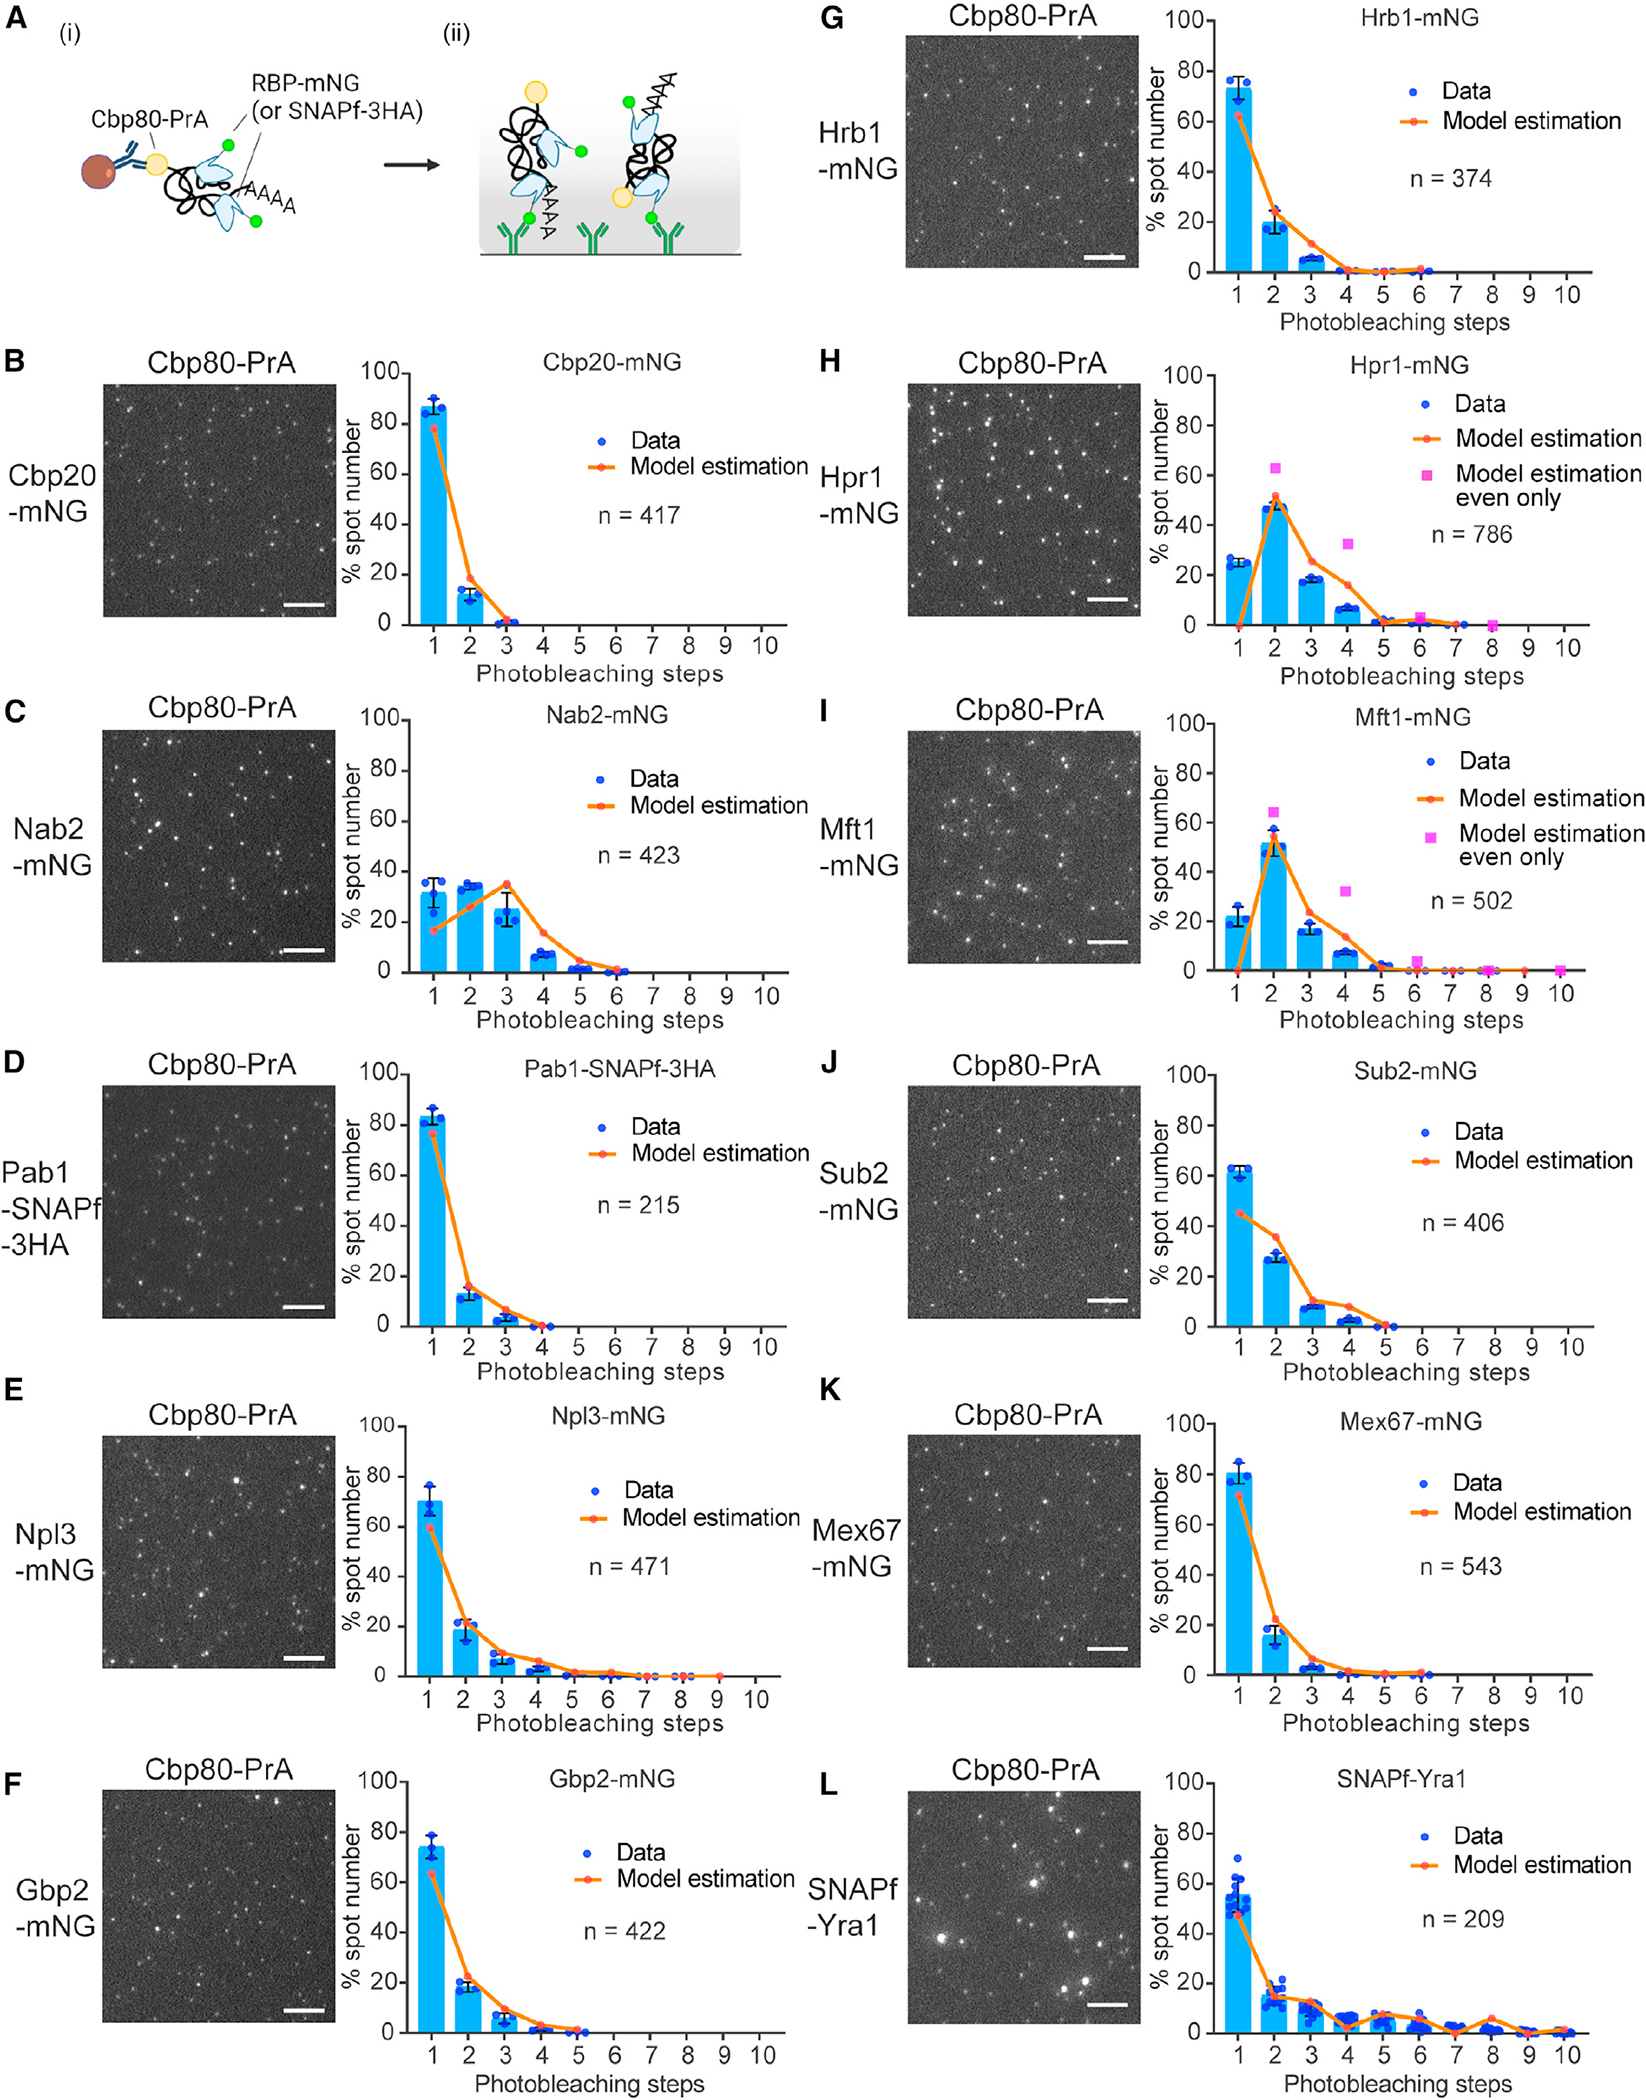
Figure 3. mRNA biogenesis and export-related RBP stoichiometry in CBC-containing mRNPs.

(A) Cartoon depicts the pull-down procedure for RBP-mNG- or -SNAPf-containing mRNPs in mRNP-SiMPull. Pull-down was performed by (i) IgG-beads followed by (ii) mRNP capturing via mNG, HA (for SNAPf-3HA), or Yra1 antibody on the glass surface.
(B–L) Representative TIRF images of target RBPs (B: nuclear cap-binding complex component, Cbp20, C: nuclear poly A binding protein, Nab2, D: cytoplasmic poly A binding protein, Pab1, E: SR-like protein, Npl3, F: SR-like protein, Gbp2, G: SR-like protein, Hrb1, H: THO complex component, Hpr1, I: THO complex component, Mft1, J: RNA helicase, Sub2, K: mRNA export receptor, Mex67, L: mRNA export adapter protein, Yra1) obtained by mRNP-SiMPull from cell lysates co-expressing Cbp80-PrA (see Figure S5A for control images with untagged Cbp80 strains). Graphs display stoichiometry distributions determined by photobleaching steps analysis. Blue bars show mean data with standard deviation with dots showing individual data points in replicate experiments (12 and three replicates for L and the others, respectively). Orange line displays the expected stoichiometry distribution following correction for fluorescent reporter activity using finite mixture modeling. For Hpr1 (H) and Mft1 (I), magenta squares represent model estimation assuming a dimer as the base unit. Average number (n) of spots analyzed per replicate experiment is indicated on each graph. Image scale bars, 5 μm.
