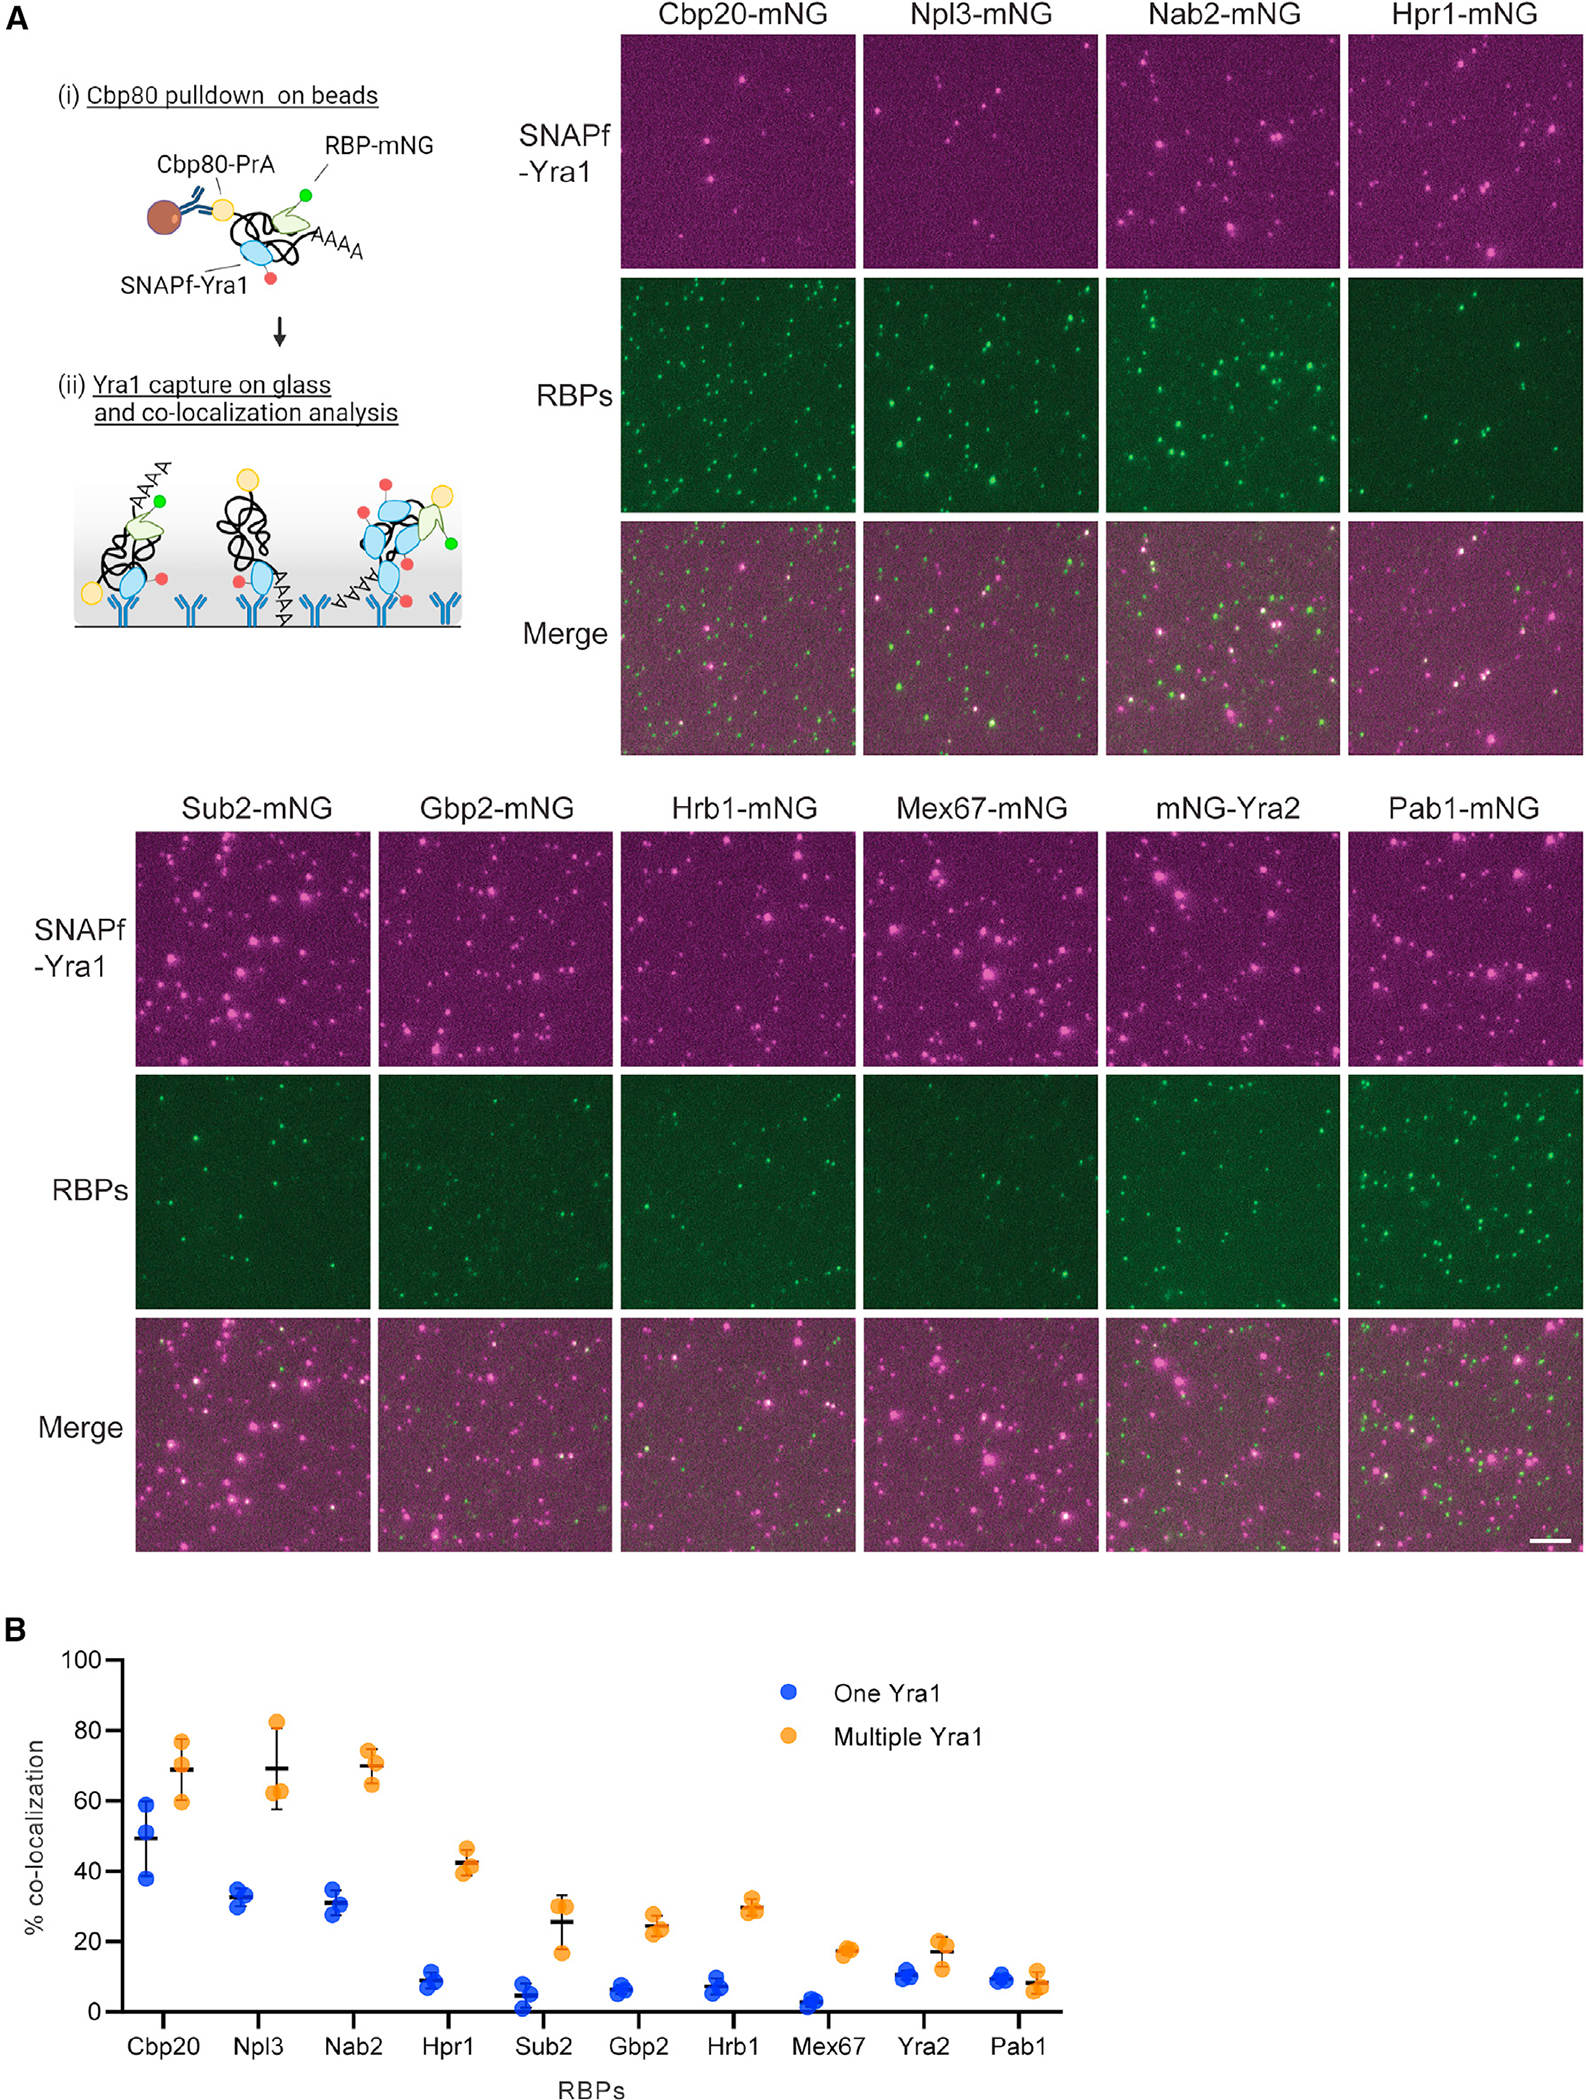
Figure 4. Co-localization analysis of Yra1 with other RBPs.

(A) Cartoon depicting the pull-down procedure for co-localization analysis of SNAPf-Yra1 and RBP-mNG by two-color mRNP-SiMPull. Pull-down was performed by (i) IgG-beads followed by (ii) mRNP capture via Yra1 antibody on the glass surface. Representative TIRF images used for co-localization analysis between SNAPf-Yra1 and other mNG-tagged RBPs. Scale bar, 5 μm.
(B) Graph shows percent co-localization with one Yra1 vs. multiple Yra1 containing spots for the indicated RBPs. Yra1 spots were separated into two groups (one or multiple Yra1) based on spot intensity (see STAR Methods and Figure S7). The mean and standard deviation of percent co-localization calculated with fluorescent protein activity-uncorrected raw data for three replicate experiments are shown for each. Averaged spot numbers analyzed in each replicate for Cbp20, Npl3, Nab2, Hpr1, Sub2, Gbp2, Hrb1, Mex67, Yra2, and Pab1 images are 266, 202, 330, 359, 446, 281, 271, 309, 257, and 240 for one Yra1 and 126, 86, 195, 171, 233, 146, 165, 267, 181, and 173 for multiple Yra1s, respectively.
