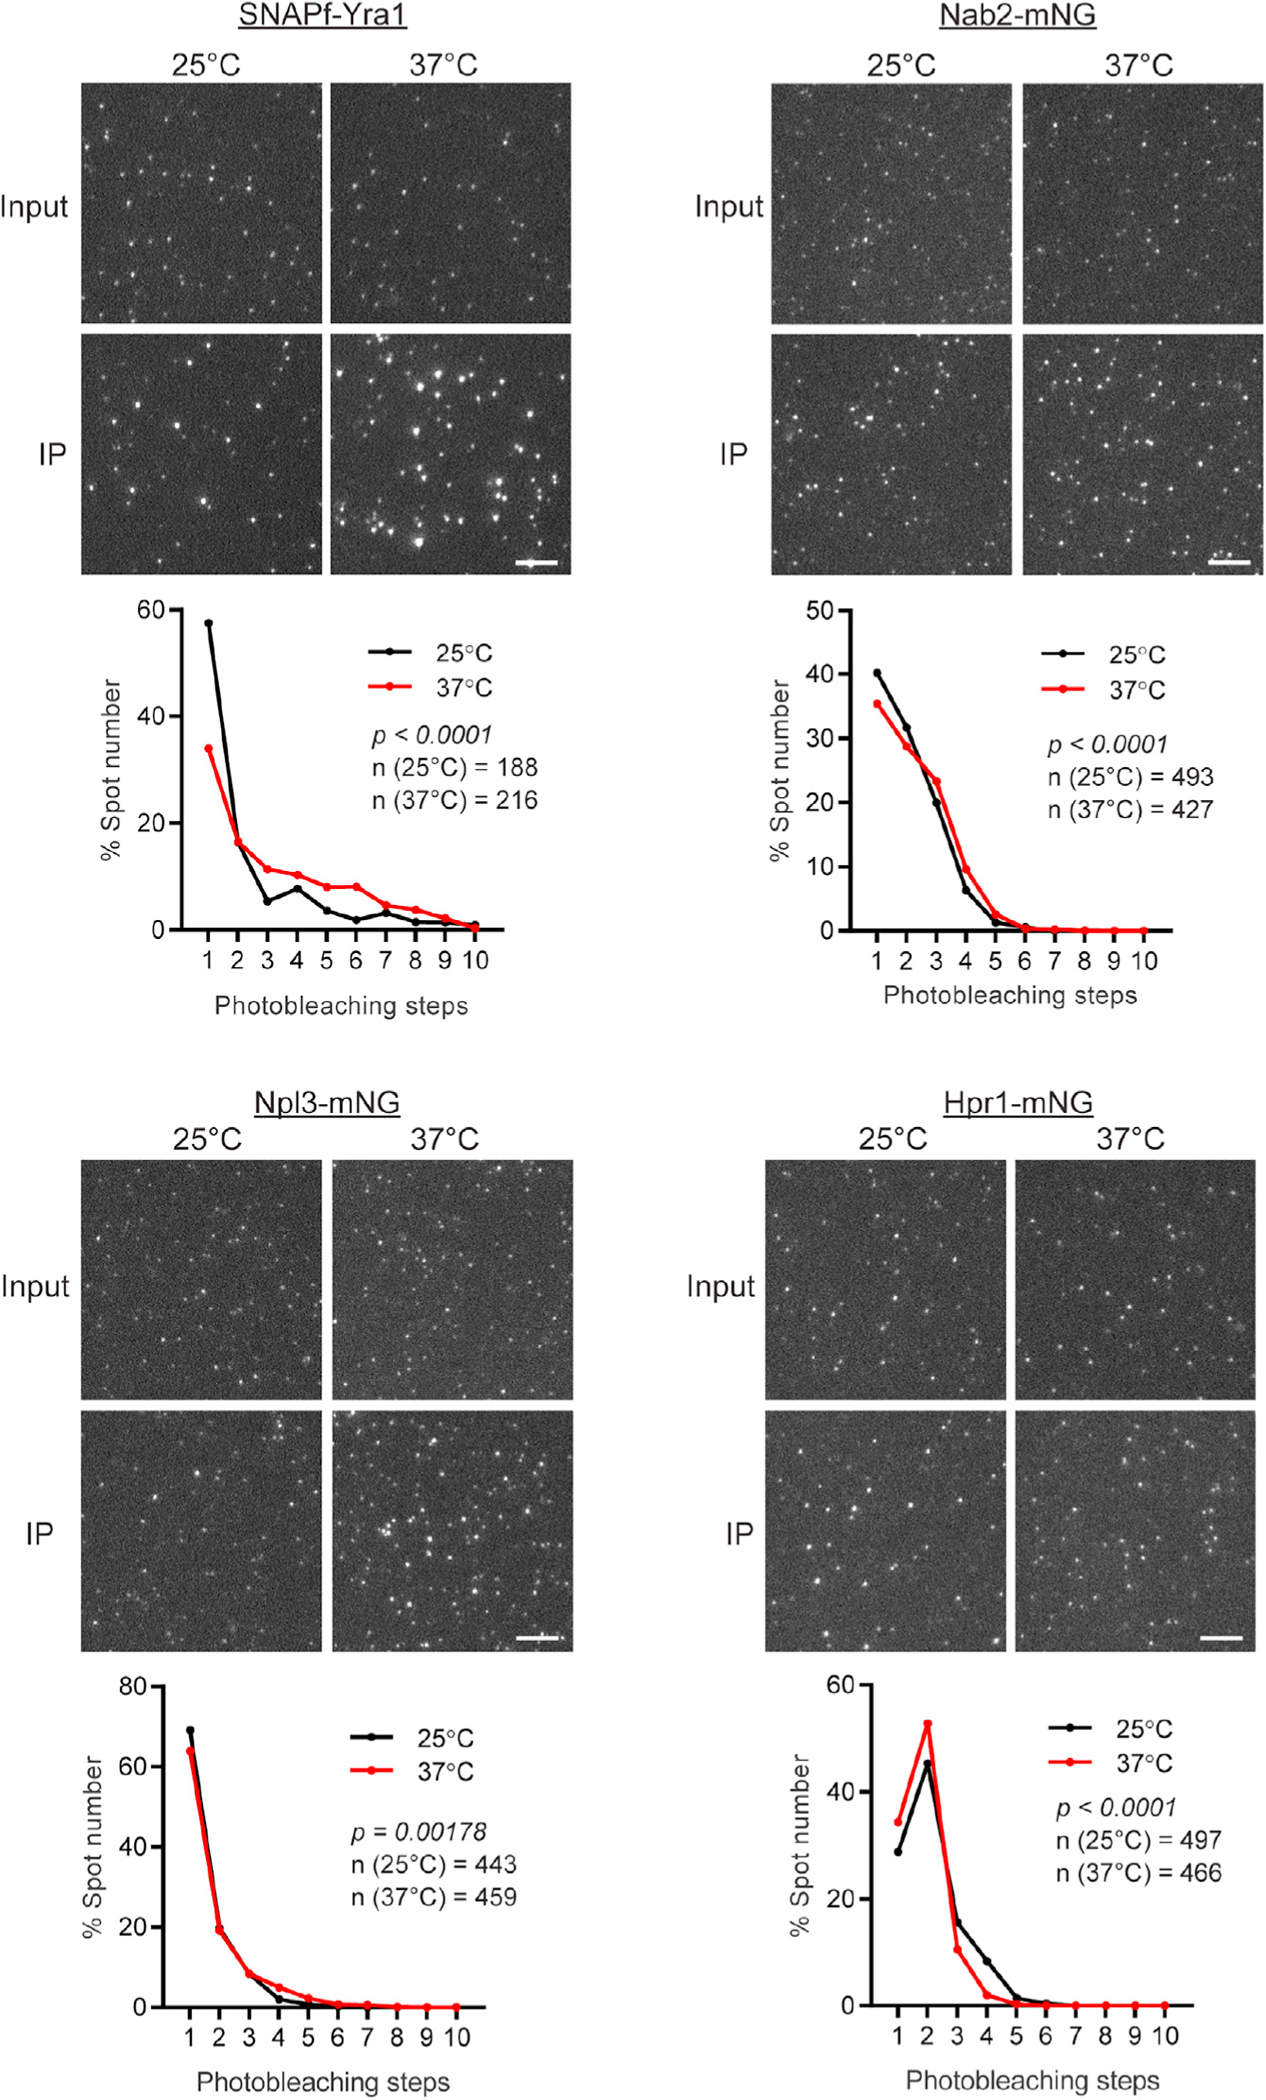
Figure 7. RBP stoichiometry in mRNPs is altered by cell growth temperature.

Representative TIRF images of SNAPf-Yra1, Nab2-mNG, Npl3-mNG, and Hpr1-mNG obtained by mRNP-SiMPull from cells grown at 25°C or 37°C for 2 h. IP (Cbp80-PrA pull-down) and input (cell lysate sample) images are shown. Scale bar, 5 μm. Line graphs show uncorrected raw mean photobleaching step data from triplicate experiments for 25°C and 37°C. p values were calculated by a non-parametric Kolmogorov-Smirnoff (KS) two-sample tests. Average number (n) of spots analyzed per replicate experiment is indicated on each graph.
