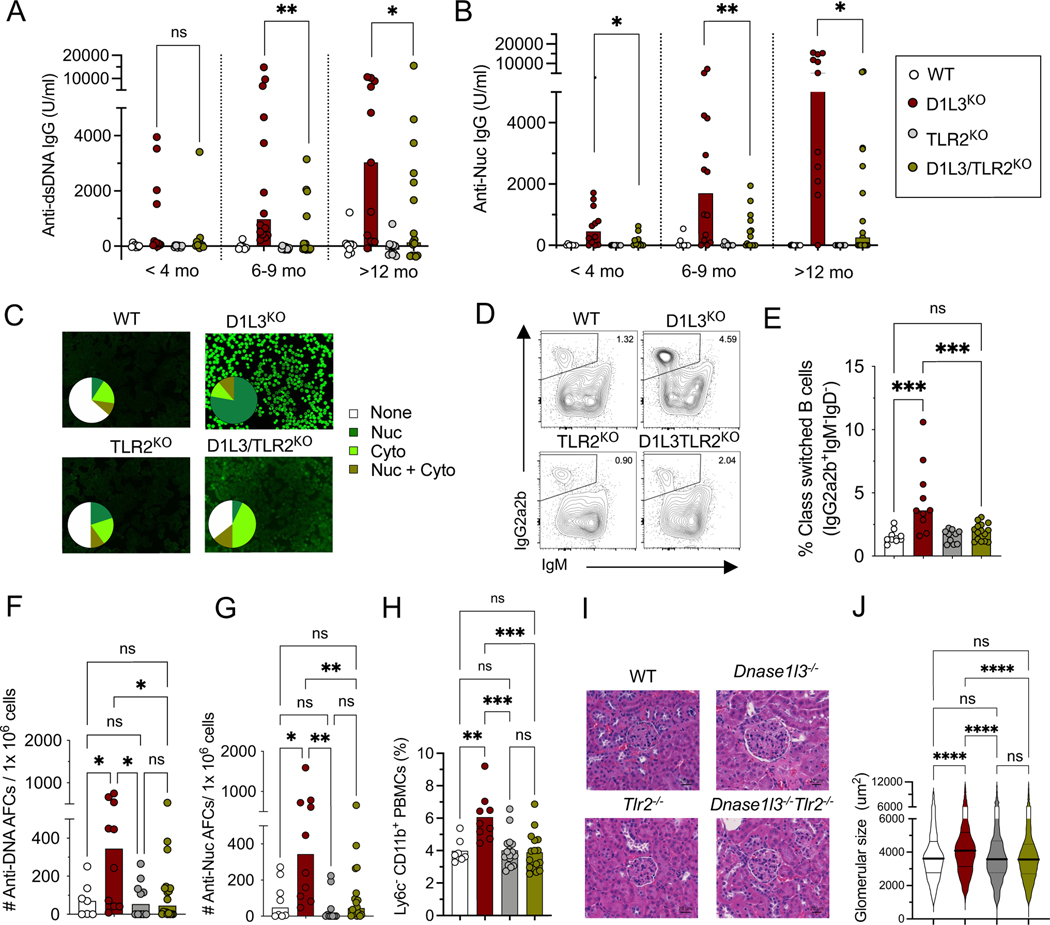
Figure 1. Deletion of TLR2 ameliorates autoimmunity in D1L3KO mice.
Mice deficient for DNASE1L3 (D1L3KO, red symbols), TLR2 (TLR2KO, grey symbols) or both (D1L3/TLR2KO, green symbols) or wild-type controls (WT, open symbols) were analyzed at 1 year of age unless indicated otherwise.
(A-B) Serum anti-dsDNA IgG titers (A) and anti-Nuc titers (B), at the indicated ages as measured by ELISA.
(C) Serum ANA reactivity, showing representative staining images and the distribution of ANA reactivity pattern (9–14 mice per genotype).
(D-E) Frequency of IgG2a2b+ IgM− class-switched B cells in the spleen.
(F-G) Frequency of anti-dsDNA (F), and anti-nucleosome (G) antibody-forming cells (AFCs) per 106 splenocytes as determined by ELISpot.
(H) Fraction of CD11c+ CD11b+ Ly6c− population among total PBMCs as determined by flow cytometry.
(I) Histology images of glomeruli from kidney sections stained with hematoxylin and eosin (scale bars, 20 μm). Representative of 5 female mice per group.
(J) The size of glomeruli in the kidneys of mice of indicated genotypes. Shown are violin plots with median (thick lines) and quartiles (thin lines). All the glomeruli from a single kidney section from 5 mice per genotype were measured.
In all bar graphs, symbols represent individual mice and bars indicate median. Statistical significance: ns, not significant; * p ≤ 0.05; ** p ≤ 0.01; ***p ≤ 0.001; **** p ≤ 0.0001.

