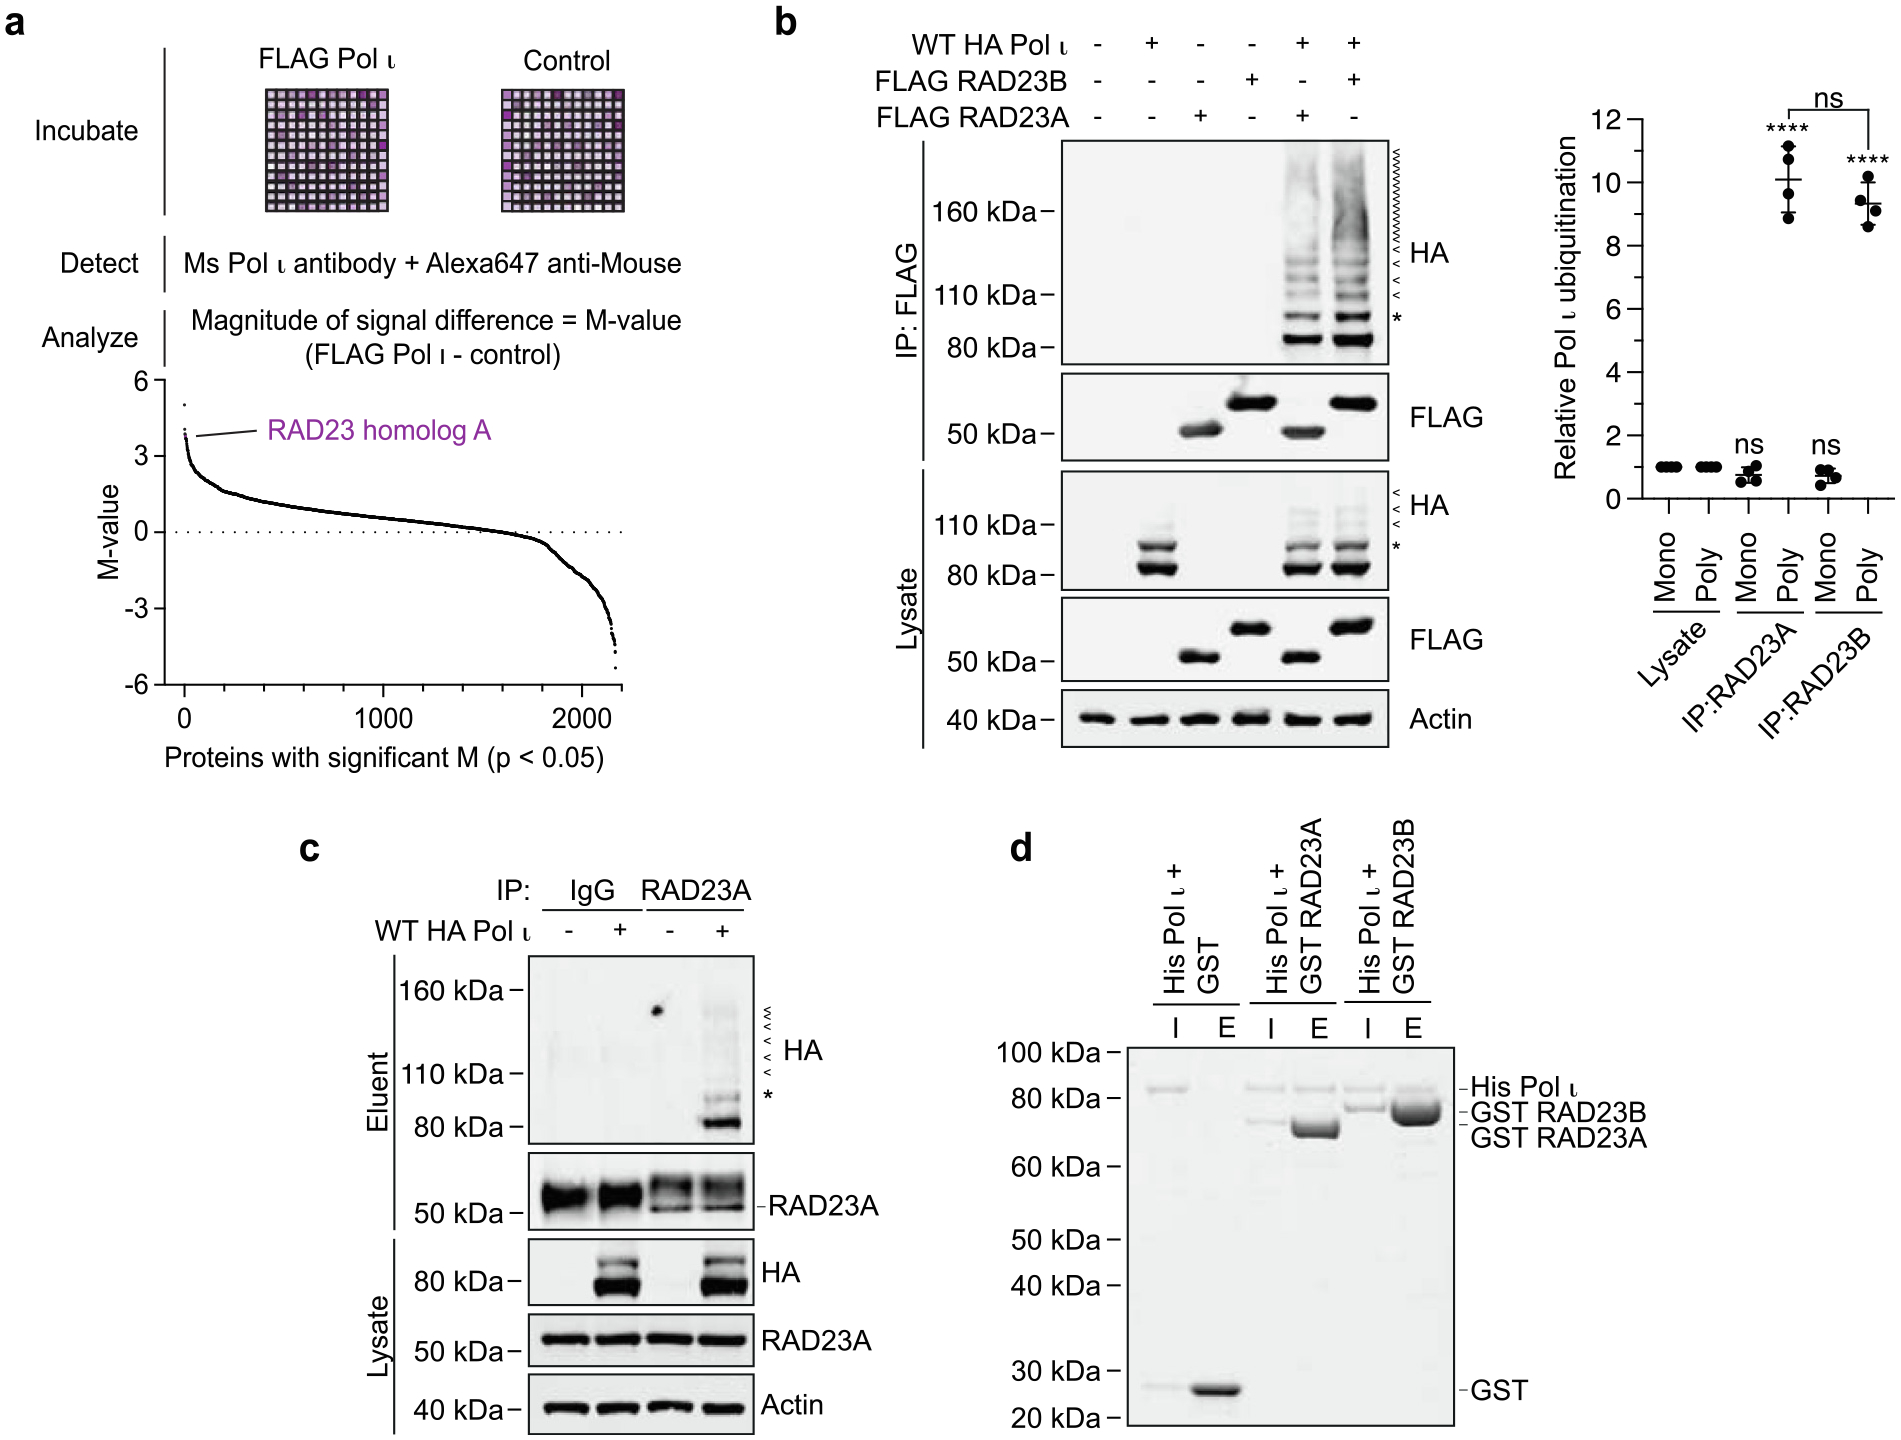
Figure 1.

Pol ι interacts with RAD23A and RAD23B. (a) Schematic representing the protein microarray used to detect Pol ι protein interactions in vitro. The graph below represents the 2211 immobilized proteins for which statistically significant differences in signal intensity were detected between Pol ι-incubated and control plates. (b) Immunoprecipitation of WT FLAG-tagged RAD23A or RAD23B from cells co-expressing WT HA-Pol ι. Eluent and lysate (input) were immunoblotted as indicated. * = mono-ubiquitinated Pol ι, < = poly-ubiquitinated Pol ι. The bar graph represents the relative proportion of mono and poly-ubiquitinated Pol ι in the eluent, normalized to the proportion of Pol ι ubiquitination detected in the lysate. (c) Immunoprecipitation of endogenous RAD23A from 293 T cells co-expressing WT HA-Pol ι. Eluent and lysate (input) were immunoblotted as indicated. (d) Recombinant His-Pol ι (1.5 μg) was incubated with equimolar quantities of GST (0.5 μg) or GST-tagged RAD23A (2.5 μg) and GST-tagged RAD23B (2.7 μg). GST was captured on glutathione sepharose beads, washed, and eluted. Proteins were separated by gel electrophoresis and proteins stained with Coomassie blue (shown in greyscale). I = 10% input, E = 50% eluent.
