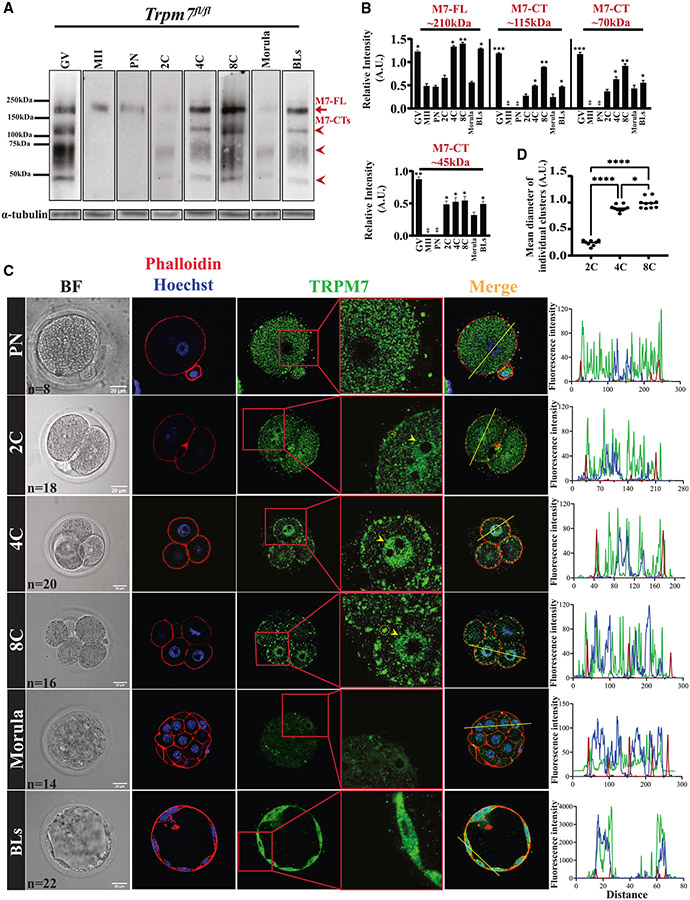
Figure 3. TRPM7 displays stage-specific expression and distinct distributions in preimplantation embryos.
(A) WB of TRPM7 reactivity in oocytes, eggs, and preimplantation embryos (n = 50). The red arrow denotes the full-length protein, M7-FL, and the arrowheads denote the three most abundant C-terminal fragments. α-tubulin reactivity is shown below each lane and was used to normalize TRPM7 quantifications.
(B) The relative intensities of M7-FL and M7-CTs between oocytes, eggs, and embryos were quantified from three replicates, statistically compared, and represented by bar graphs. Columns without asterisks are stages with lower and statistically significant expression compared with those with asterisks (*p < 0.05, **p < 0.01, or ***p < 0.001), whereas for the bars with asterisks, a different number of asterisks indicates a difference between groups (*p < 0.05 or **p < 0.01).
(C) Bright-field (left column) and IF images of PN, 2C, 4C, 8C, morula, and BL stage embryos (remaining columns) displaying actin distribution by phalloidin labeling (red) and nuclear DNA by Hoechst staining (blue) (second column) and TRPM7 distribution (green; three rightmost columns).A yellow trace in the Merge column denotes the line where the fluorescence was estimated for the three probes. On the right, the line plots display the intensity of the fluorescent signals across the embryos. The number (n) of cells and embryos examined per stage is indicated in the bright-field images, and the white bars represent distance in micrometers.
(D) Comparison of the sizes of the TRPM7 PM clusters observed in the 2C, 4C, and 8C stage embryos (*p < 0.05, ****p < 0.0001). Comparisons were carried out using ANOVA followed by Tukey’s post hoc tests.

