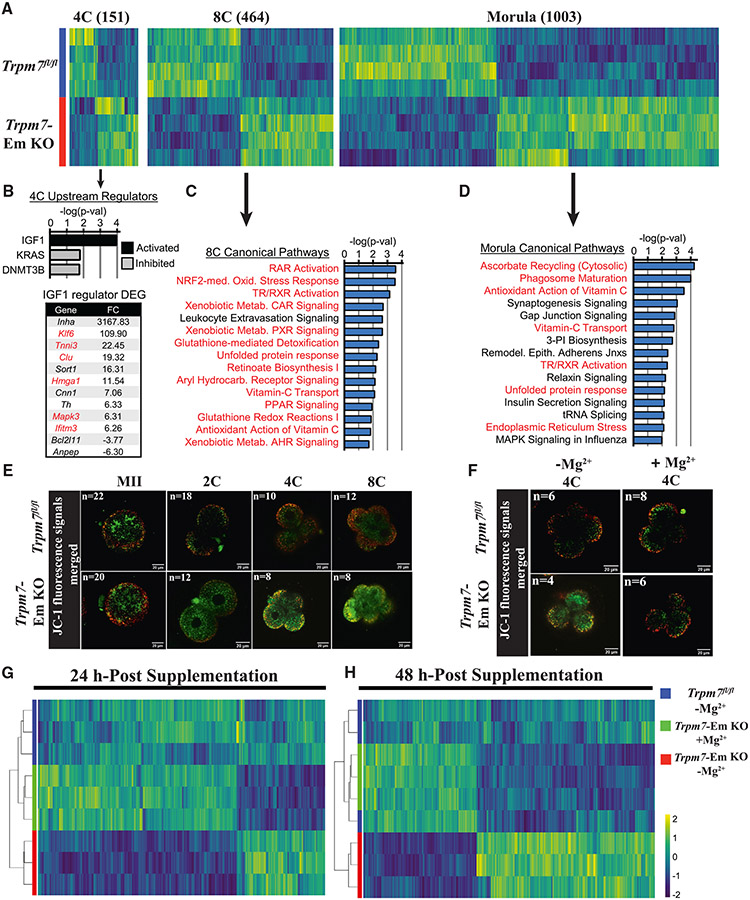
Figure 7. TRPM7 expression prevents oxidative stress in preimplantation embryos by promoting Mg2+influx.
(A) Heatmap representation of the comparison of differentially expressed genes (DEGs) identified by RNA-seq in Trpm7fl/fl control embryos relative to Trpm7-Em KO embryos at the four-cell (4C), 8C, and morula stages. The number of DEGs at each stage is indicated in parentheses above each group.
(B) Ingenuity pathway analysis (IPA) of upstream regulators predicted as activated or inhibited in 4C embryos; p < 0.05. DEGs present in the IGF1 upstream regulator dataset and fold change (FC) are shown; red font indicates a role in mitochondrial function, inflammation, or oxidative stress.
(C and D) IPA of canonical pathways in 8C embryos (C) and morulae (D); the 15 most significant pathways relevant to the two embryo stages are shown. The red font indicates oxidative stress-related pathways.
(E and F) Mitochondrial membrane potential as indicated by merged ratio images of JC-1 staining of MII eggs and embryos of the indicated genotypes and cellular stages. Representative images of all embryo stages examined are shown (E). Embryos of both strains were handled as before but supplemented or not with Mg2+ at the 2C stage and cultured to the 4C stage (F).
(G and H) Unsupervised hierarchical clustering of DEGs identified by RNA-seq at the indicated time points in Trpm7fl/fl, Trpm7-Em KO, and Trpm7-Em KO embryos cultured with and without added Mg2+.

