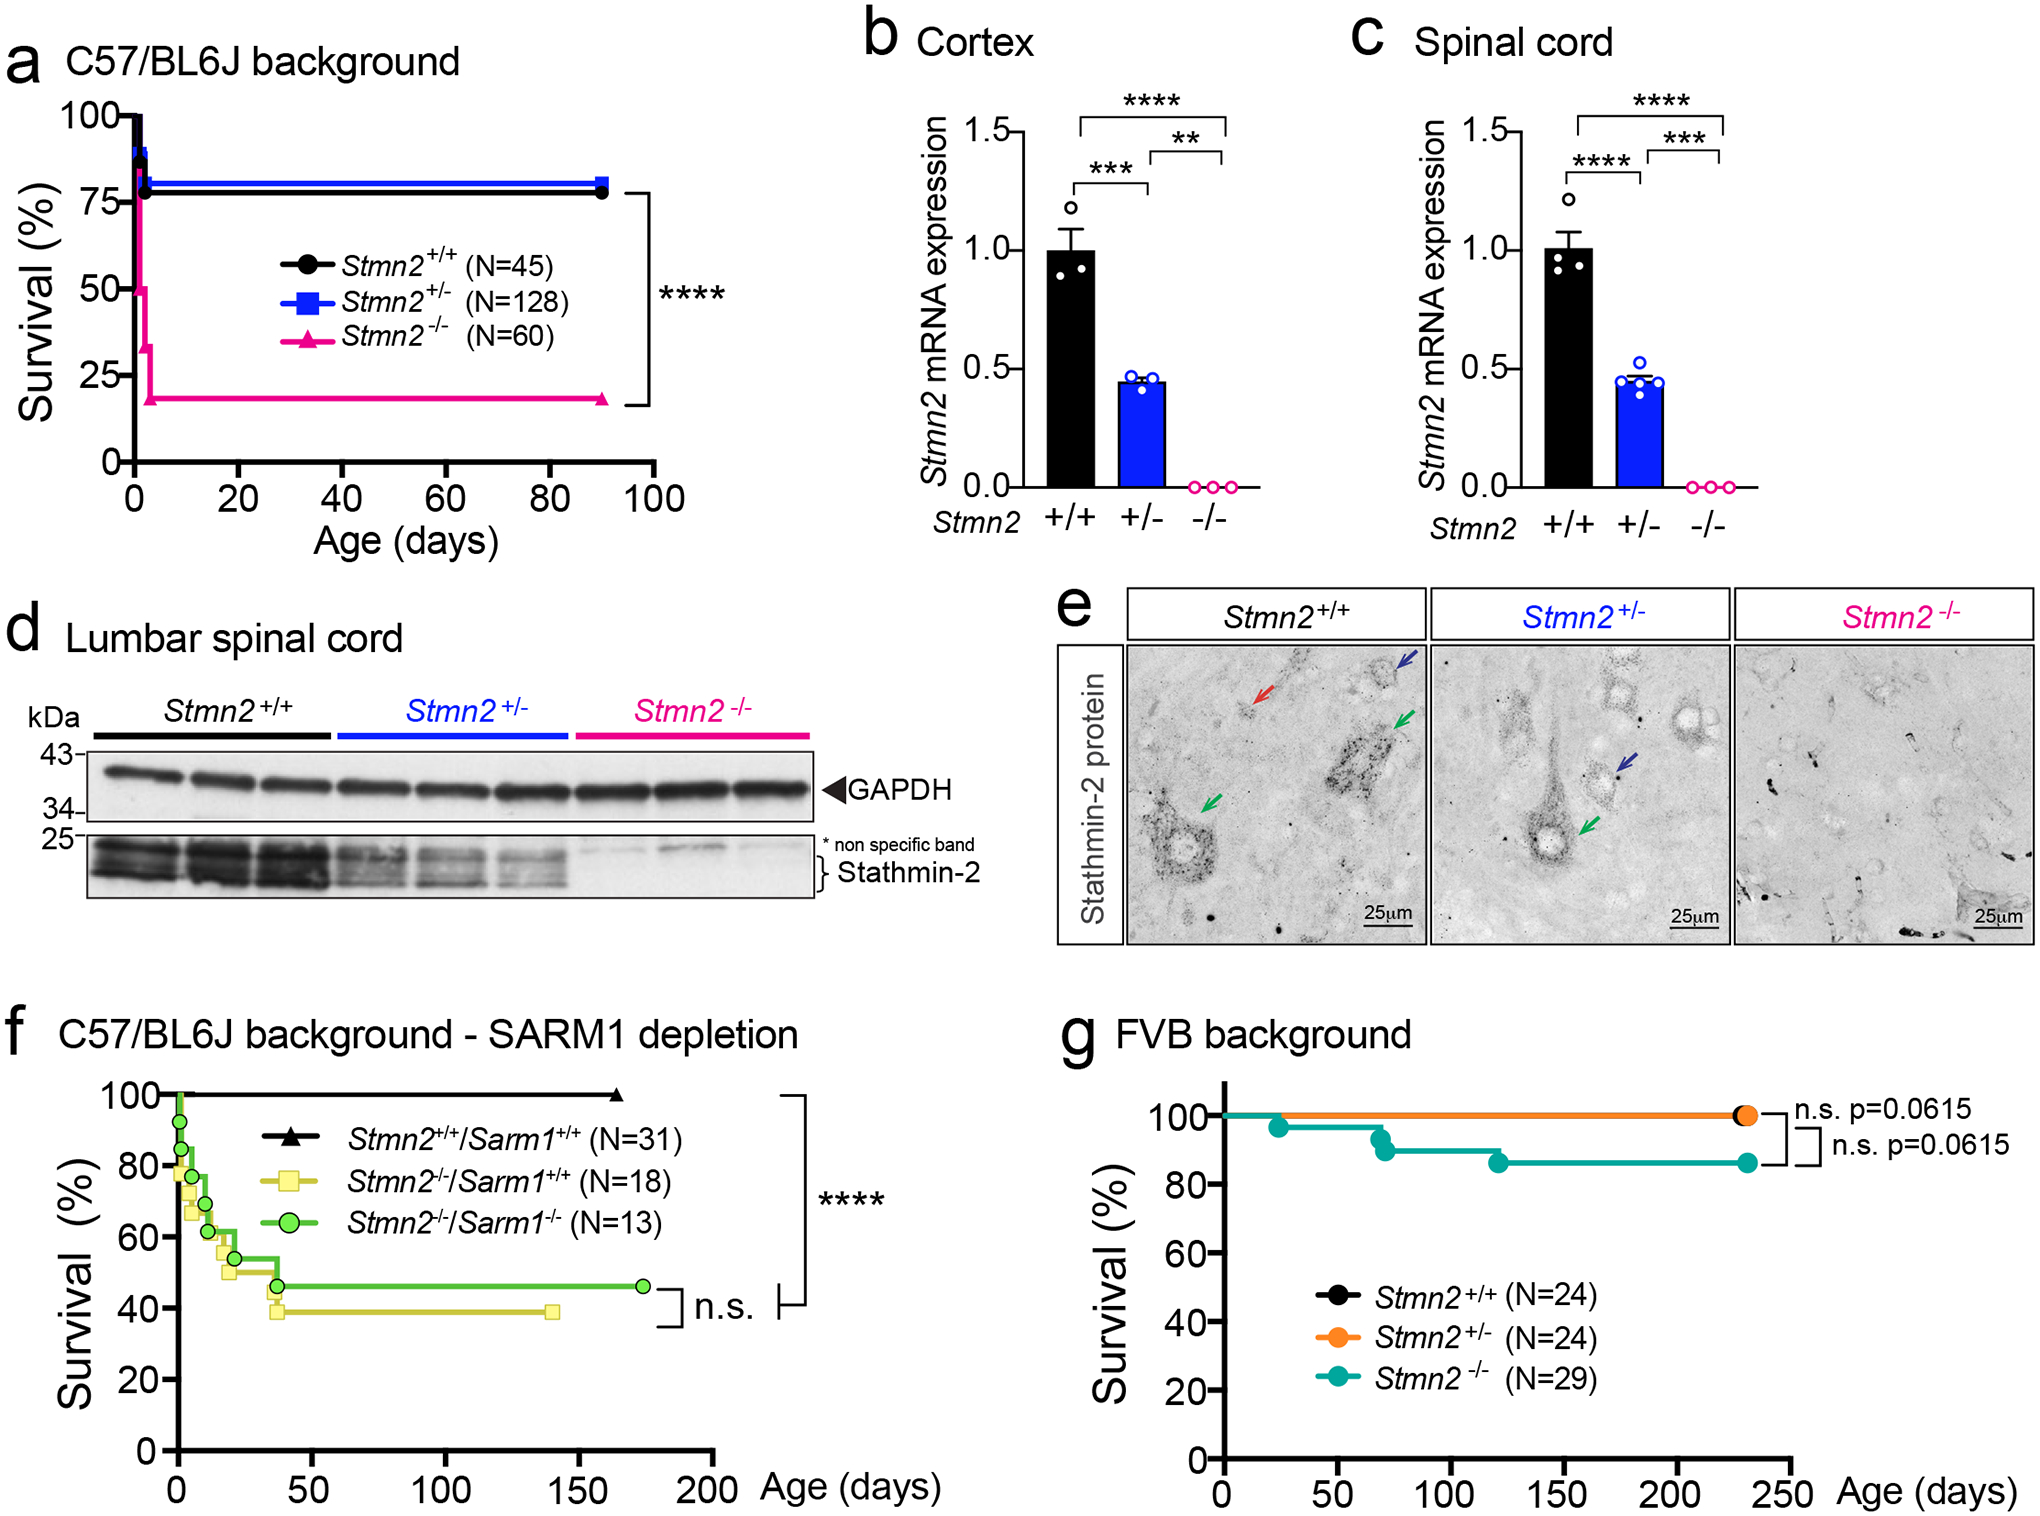
Figure 5: Stathmin-2 has an important role early after birth, rescued by FVB genetic background but not by Sarm1 ablation.

(a) Survival curve of Stmn2+/+, Stmn2+/− and Stmn2−/− mice in a C57/BL6J background. Statistical analysis by Log-rank Mantel-Cox test (P < 0.0001) (b-c) Measurement of murine Stmn2 mRNA levels extracted from cortex (n=3 animals per genotype) (b), and spinal cord (c) of Stmn2+/+, Stmn2+/− and Stmn2−/− mice. Each data point represents an individual mouse. Gapdh was used as an endogenous control gene. Statistical analysis by two-sided, one-way ANOVA post hoc Tukey’s multiple comparisons test. For spinal cords, n=4 animals for Stmn2+/+; n=5 animals for Stmn2+/−; and n=3 animals for Stmn2−/− were used. Range of p values from P = 0.0027 to P < 0.0001 (b) and P = 0.0002 to P < 0.0001 (c). (d) Immunoblot showing levels of the ~21 kDa mouse stathmin-2 protein from n = 3 different animals per genotype. GAPDH was used as a loading control. (e) Confocal micrographs of stathmin-2 immunolabeling at the ventral spinal cord of 12-month-old Stmn2+/+, Stmn2+/− and Stmn2−/− mice. Green arrows: α-motor neurons; blue arrows: γ-motor neurons; red arrows: interneurons. At least n = 3 different animals per genotype were imaged with similar results. (f) Survival curve of Stmn2+/+/Sarm1+/+, Stmn2−/−/Sarm1+/+ and Stmn2−/−/Sarm1−/− mice in a C57/BL6J background. Statistical analysis by Log-rank Mantel-Cox test (P < 0.0001). (g) Survival curve of Stmn2+/+, Stmn2+/− and Stmn2−/− mice in FVB background. Statistical analysis by Log-rank Mantel-Cox Test. All panels: Error bars plotted as SEM. ****, P <0.0001; ***, P < 0.001; **, P < 0.01; *, P <0.05; ns, P >0.05.
